
Figure EV3. Supporting figures for main Fig 2 .
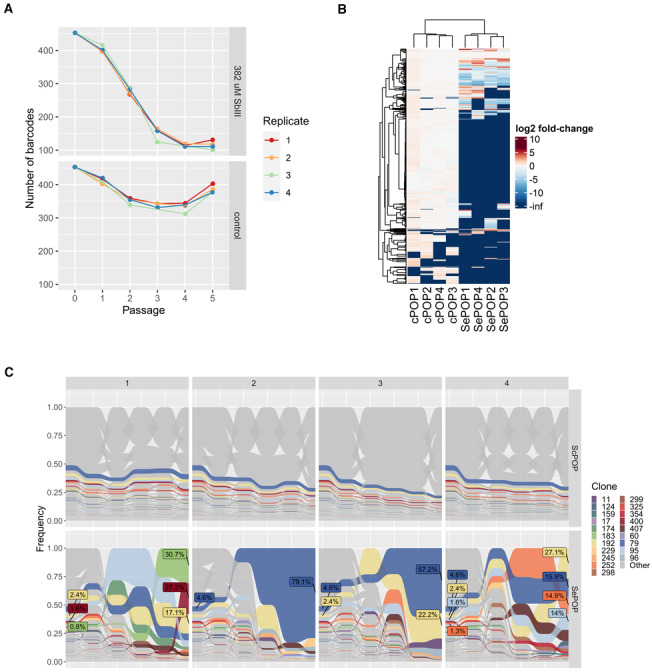
- Total number of different barcodes identified in each population at each timepoint in the SbIII‐exposed populations (top) and the controls (bottom).
- Heatmap displaying the SbIII‐associated fold‐change of each lineage (rows) in each population (columns) at passage 5.
- Frequency of each barcoded lineage along the 5 passages in the ScPOP1‐4 (top) and SePOP1‐4 (bottom) populations. This is similar to main Fig 2F but includes the ScPOP1‐4 for comparison. Only lineages that reached a frequency higher than 1% at passage 5 in at least one of the SePOP populations are colored.