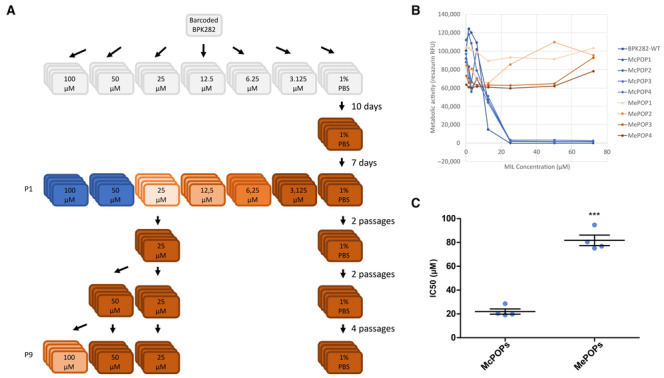
Figure EV4. Supporting figures for flash selection with miltefosine.

- Schematic representing the experimental design. Colors indicate the lack of viable parasites (blue) or the relative observed number of parasites at day 7 compared to the controls (darker brown = more cells).
- Dose–response to miltefosine of the metabolic activity of the populations at the first passage after exposure to the drug, estimated with the resazurin assay.
- Difference in IC50 of the same populations one passage later. ***P < 0.001 (t‐test).
