-
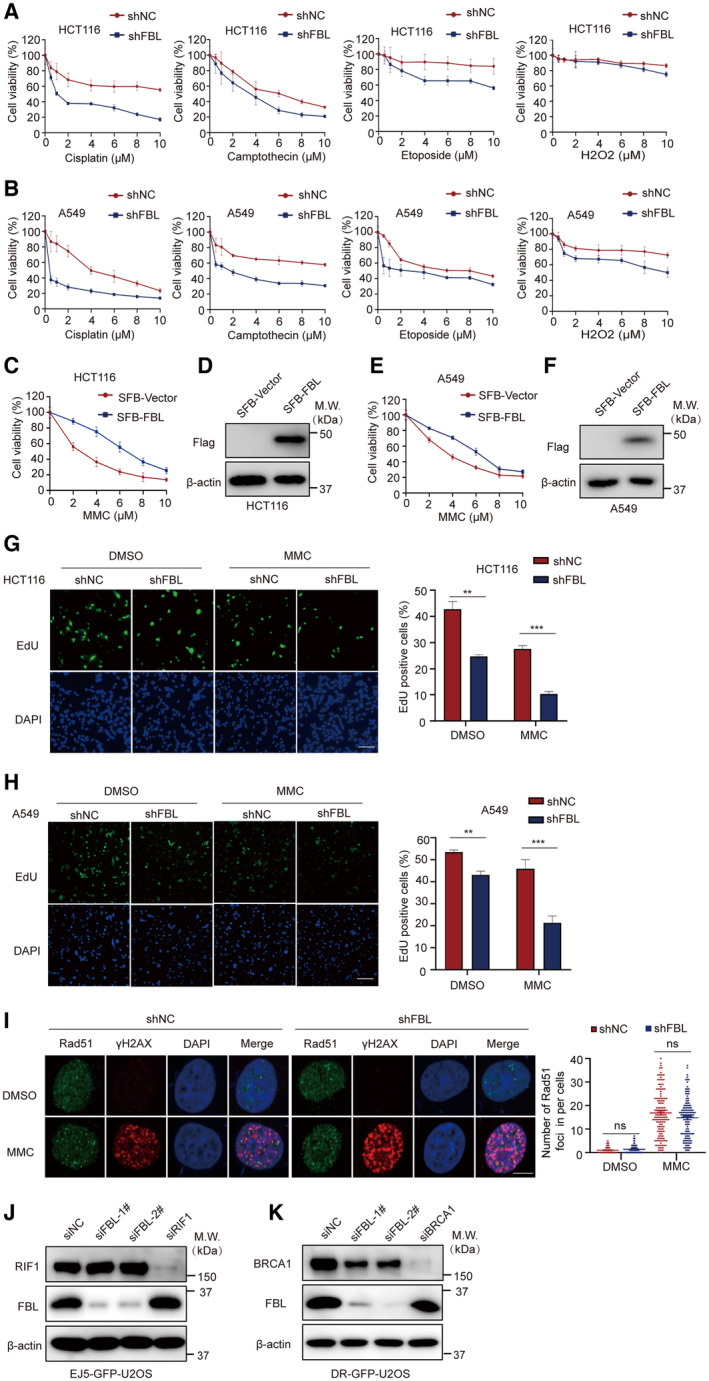
A, B
Cell viability analysis was performed on control (shNC) and shFBL‐HCT116/shFBL‐A549 cells treated with indicated concentrations of cisplatin, etoposide, camptothecin, or H2O2 using CCK‐8 assays. Each data point represents the mean ± SD from three replicates.
-
C–F
(C, E) FBL overexpression cells are sensitive to MMC. FBL WT or empty vector HCT116/A549 cells were treated with MMC. Cell survival was measured by CCK‐8 assay. Each data point represents the mean ± SD from three replicates. (D, F) Cells were reconstituted with full‐length FBL in HCT116/A549 cells. Protein expressions were examined by western blot with indicated antibodies.
-
G, H
Immunofluorescence analysis of 5‐ethynyl,2′‐deoxyuridine (EdU) incorporation and quantitative analysis of EdU‐positive cells with 5 μM MMC or DMSO treatment. Scale bar, 50 μm. The bar graphs present data as mean ± SD from three independent experiments. The statistical significance was determined using one‐way ANOVA. **P < 0.01 and ***P < 0.001.
-
I
Immunofluorescence staining showed the formation of γH2AX and Rad51 foci in shFBL and shNC HCT116 cells treated with 5 μM MMC or mock treatment. The scale bar represents 10 μm. The right panel displays quantification of the left panel: indicating the number of Rad51 foci per cell (n ≥ 100 cells). The bar graphs present data as mean ± SD from three independent experiments. The statistical significance was determined using one‐way ANOVA. ns. no significance.
-
J, K
Western blotting analysis of FBL levels in FBL knockdown EJ5‐GFP‐U2OS/DR‐GFP‐U2OS cells.

