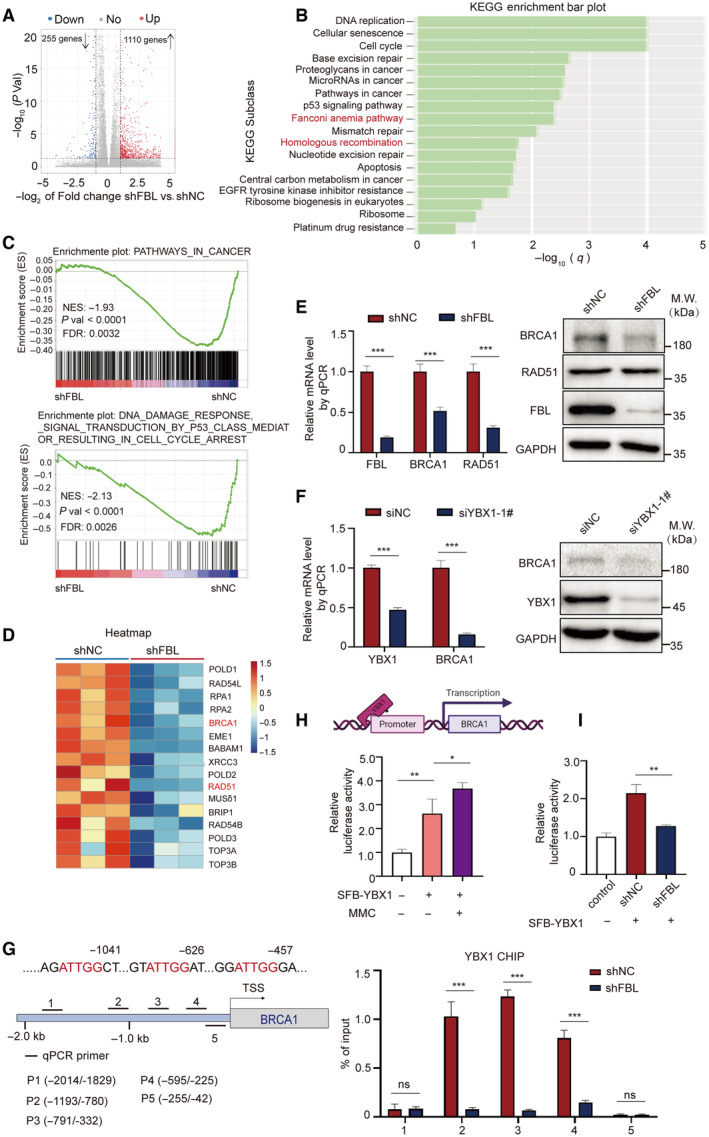
Figure 5. FBL promotes the transcriptional activation of BRCA1 via YBX1.

- A volcano plot of differentially expressed gene analysis results for RNA‐seq data comparing FBL KD HCT116 cells (n = 3) to control cells (n = 3). The dots for significant upregulated or downregulated genes were colored in red or blue, respectively.
- KEGG enrichment analysis for differentially expressed genes comparing FBL KD HCT116 cells to control cells.
- GSEA plots showing an interesting gene set from MSigDB were enriched for gene downregulated in FBL KD HCT116 cells for PATHWAYS_IN_CANCER and PATHWAYS_IN_DNA_DAMAGE_RESPONSE_SIGNAL_TRANSDUCTION_BY_ P53_CLASS_MEDIATOR_RESULTING_IN_CELL_CYCLE_ARREST.
- Heatmap illustrating relative expressions of core‐enriched genes in HR gene set in FBL KD cells compared to control cells.
- The mRNA and protein levels of BRCA1 and RAD51 were validated by RT–qPCR and western blot assays using FBL KD HCT116 cells or control cells. Ct values were normalized to GAPDH. The bar graphs present data as mean ± SD from three independent experiments. The statistical significance was determined using Student's t‐test. ***P < 0.001.
- The mRNA and protein levels of BRCA1 were validated by RT–qPCR and western blotting assays using YBX1‐silenced HCT116 cells or control cells. Ct values were normalized to GAPDH. The bar graphs present data as mean ± SD from three independent experiments. The statistical significance was determined using Student's t‐test. ***P < 0.001.
- FBL mediates the recruitment of YBX1 at the promoter region of BRCA1. The top panel is a schematic diagram of BRCA1 promoter region. Bold lines indicate the positions of five primer pairs designed for qPCR analysis of CHIP. The lower panel is ChIP–qPCR measurement of the relative occupancy of YBX1 on different regions of BRCA1 promoters in FBL KD HCT116 cells or control cells. Cells were treated with 5 μM MMC overnight. ChIP analyses on the BRCA1 promoter were performed with IgG or YBX1 antibodies, followed by qPCR using primers that amplify different BRCA1 promoter regions. The bar graphs present data as mean ± SD from three independent experiments. The statistical significance was determined using Student's t‐test. ns denotes not significant, ***P < 0.001.
- MMC treatment increases the YBX1‐mediated transcription activity of BRCA1. The BRCA1 promoter region from −2.0 to 0 kb was cloned for dual‐luciferase reporter assays. HCT116 cells were transiently cotransfected with the BRCA1 promoter, luciferase reporter constructs, and YBX1 expression vectors with MMC treatment. Twenty‐four hours after cotransfection, all samples were harvested for luciferase activity experiments. The bar graphs present data as mean ± SD from three independent experiments. The statistical significance was determined using Student's t‐test. *P < 0.05 and **P < 0.01.
- FBL KD inhibits the transcriptional activation of BRCA1 dual‐luciferase reporter assays evaluating the effect of FBL KD on YBX1‐mediated transcription activity of BRCA1. The bar graphs present data as mean ± SD from three independent experiments. The statistical significance was determined using Student's t‐test. **P < 0.01.
Source data are available online for this figure.
