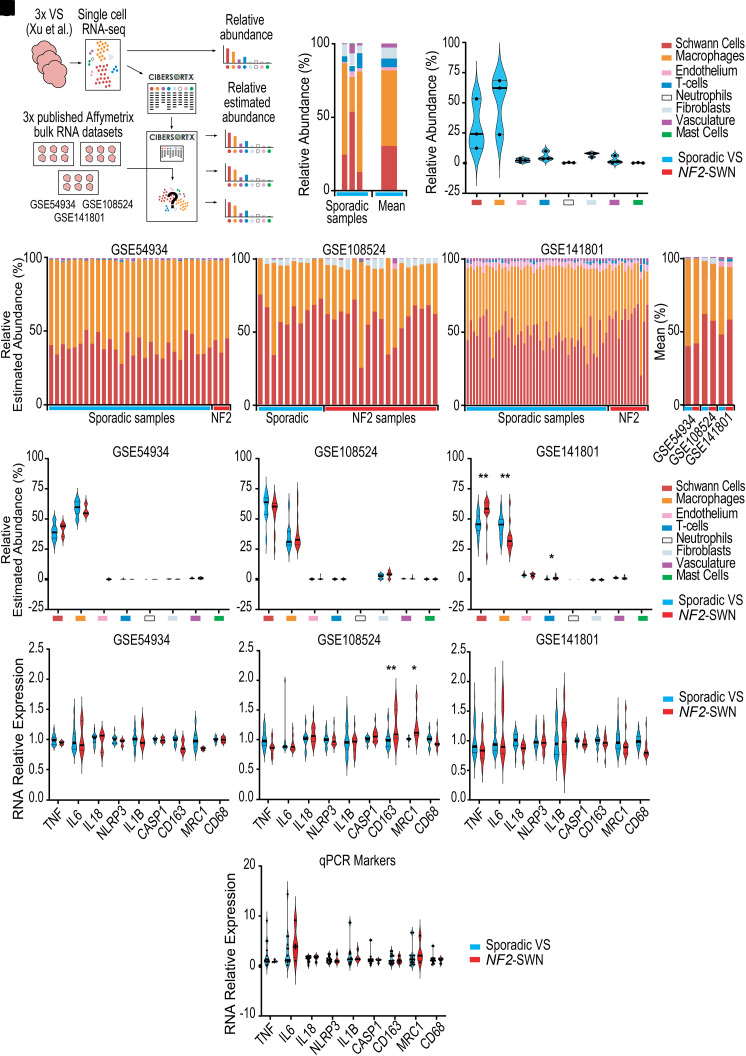
Figure 3.
Schwann cells and macrophages are the most abundant cell types in sporadic and NF2-related schwannomatosis (NF2-SWN) vestibular schwannoma (VS). (A, C) Workflow for the use of single-cell RNA data (sporadic VS n = 3) published by Xu et al. (2022)32 available at National Omics Data Encyclopaedia accession code OEP001871 used (A) to identify relative cell abundance (B, C) and create new CIBERSORTx signature matrix.24 All data acquired from GSE54934, GSE108524 and GSE141801 available from Gene Expression Omnibus. GSE54934 included control vestibular and eighth cranial nerve n = 2, sporadic VS n = 28 and NF2-SWN VS n = 3. GSE108524 included control vestibular nerve n = 4, sporadic VS n = 10 and NF2-SWN VS n = 17. GSE141801 included control vestibular nerve n = 7, sporadic VS n = 45 and NF2-SWN VS n = 13. (D–G) Relative estimated abundance of cell populations by bulk RNA expression deconvolution (D–F) and mean estimated abundance across all three datasets (G). (H–J) Relative estimated abundance of each cell population in each of the three datasets. (K–M) The expression of macrophage marker genes between NF2-SWN and sporadic VS in each of the three datasets. (N) Quantitative PCR (qPCR) analysis of macrophage marker gene expression between NF2-SWN and sporadic VS in an additional cohort of VS (n = 4 NF2-SWN and n = 15 sporadic VS). Relative RNA expression was calculated using the 2−ΔΔCt method normalizing to the expression of the housekeeping gene GNB2L1. Normality of the distributions of abundance and RNA expression relative to sporadic VS were determined by the Shapiro–Wilk test followed by multiple Mann–Whitney U test with Benjamini–Hochberg adjustment or a parametric two-way ANOVA with Bonferroni adjustment, respectively. Statistical significance P ≤ 0.05 (*) and P ≤ 0.01 (**).

