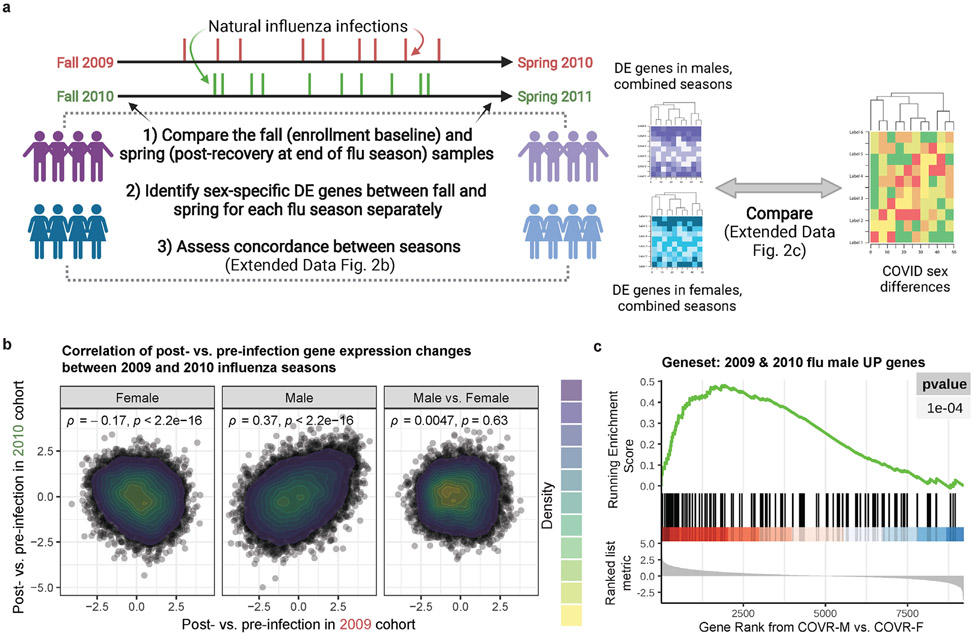
Extended Data Figure 2. Persistent post-infection gene expression changes following natural influenza infection.
a, Schematic showing the approach used to evaluate changes in blood gene expression between before (pre-infection baseline) and months after natural influenza infection over two distinct seasons published in Zhai et al18, and how those gene changes may relate to sex-specific differences resulted from prior COVID-19 in this study.
b, Scatter density plot showing the correlation between the gene expression changes (see Extended Data Table 7) before (fall) and after (spring) natural influenza A infection in 2009 (x-axis) and 2010 (y-axis) for females (F; left), males (M; center), and M vs F contrast (right). Shown are Spearman’s rank correlation and unadjusted p values.
c, Gene set enrichment plot of the genes that increased in M between fall (pre-infection) and spring (post-infection) in both 2009 – 2010 and 2010 – 2011 seasons. Genes were ranked by the signed log10(unadjusted p-value) in the COVID-19-recovered (COVR)-M vs COVR-F contrast at baseline using only subjects under 65 years of age. The tick marks denote the location of the genes in the influenza gene set.

