
Figure 4.
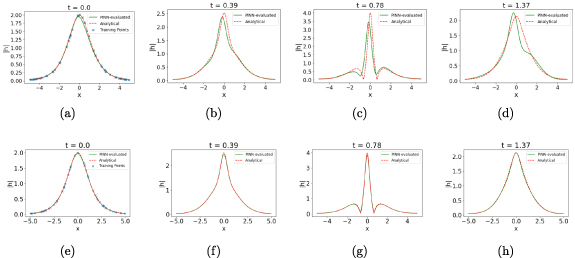
The cPINN-evaluated for two (top row) and three (bottom row) equal subdomains at different timeslices, , from left to right when no error is introduced on initial time-slice. The points marked with the blue cross (x) pointer in the leftmost set of plots indicate the samples on the initial timeslice used to train the cPINN.