
Figure 9.
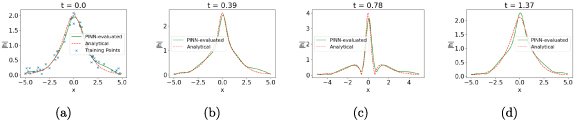
The PINN-evaluated at different timeslices, , from left to right. In this case the PINN is constained by the Schrodinger equations first conservation law: . The training data on the initial timeslice is subject to measurement errors, modeled by a Gaussian random variable with zero mean and a standard deviation of σ = 0.1. The points marked with the blue cross (x) pointer in the leftmost set of plots indicate the samples on the initial timeslice used to train the PINN.