FIGURE 1.

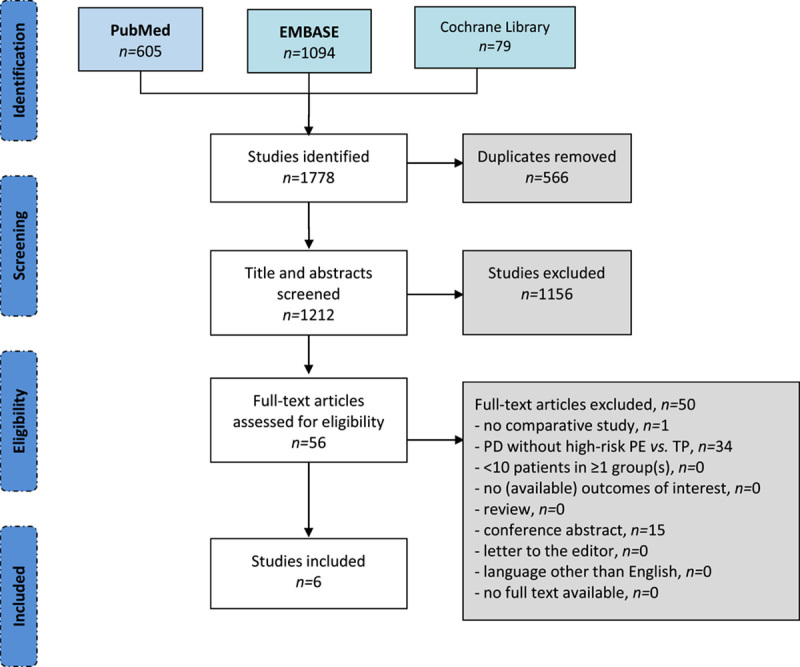
PRISMA flow chart. n indicates number of patients; PD, pancreatoduodenectomy; PE, pancreatico-enterostomy; TP, total pancreatectomy

PRISMA flow chart. n indicates number of patients; PD, pancreatoduodenectomy; PE, pancreatico-enterostomy; TP, total pancreatectomy