Figure 5.
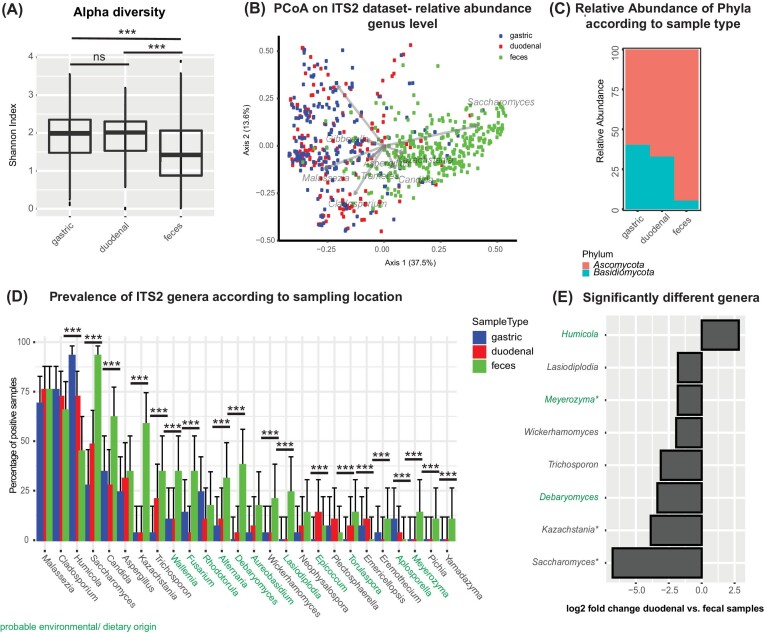
Differences in the mycobiome along the GI tract. (A) Alpha diversity in the different compartments as measured by the Shannon index. (B) PCoA plot based on the normalized Bray–Curtis dissimilarity index (log10) of the dataset iteratively rarefied to 5000 fungal sequences (gastric: N = 148, duodenal: N = 132, and feces: N=299). (C) Relative abundance of the different phyla according to sample type. (D) Differences in the mycobiome in relation to sampling location along the GI tract. Samples were considered to be positive for a given genus if they had at least a single sequence relating to this genus. Groups were compared using the Pearson chi-squared test and Benjamini–Hochberg correction for multiple testing. *P < .05; **P < .01; ***P < .005; comparison without an indication are nonsignificant. (E) Fungal genera showing significant differences in their relative abundance between duodenal and fecal samples in a DeSeq2 model correcting for sequencing depth.

