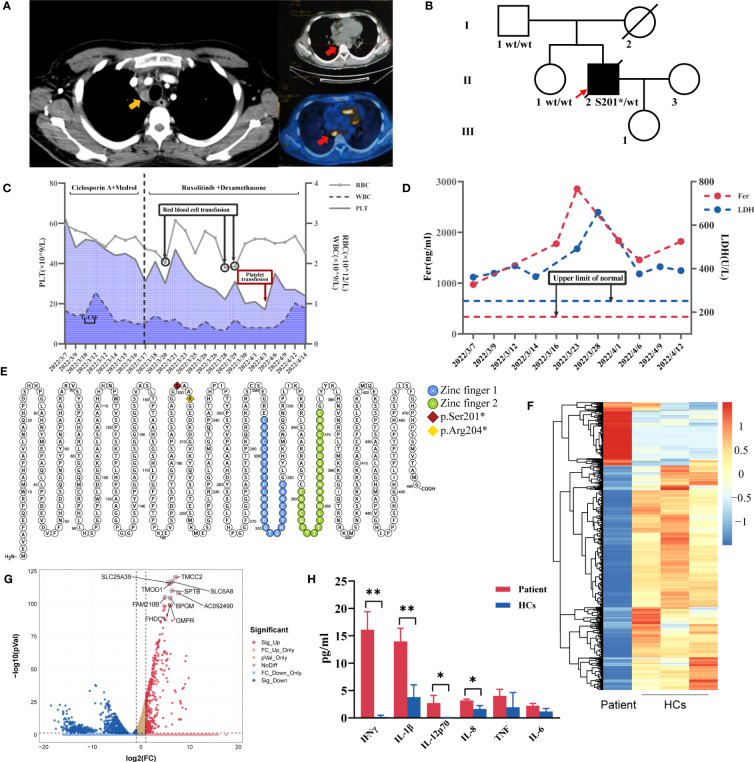
Figure 1.
(A) Chest CT showing enlarged mediastinal lymph nodes (yellow arrow) and PET/CT with hypermetabolic mediastinal lymph nodes (red arrow). (B)Pedigree chart of the patient. (C) Trends in red blood cells (RBC), white blood cells (WBC), platelet count (PLT) levels and treatments during the patient’s hospital stay. (D) Changes in ferritin (Fer) and lactate dehydrogenase (LDH) during the hospitalization. (E) GATA2 variants sites of two GATA2 deficiency-related HLH patients in our center (Protter, http://wlab.ethz.ch/protter). Heatmap (F) and volcano plot (G) for differentially expressed genes identified comparing patient and healthy controls (HCs) (volcano plot was performed using the OmicStudio tools at https://www.omicstudio.cn). (H) The comparisons of plasma levels of inflammatory cytokines between the patient and HCs. **P ≤ 0.01; *P ≤ 0.05.

