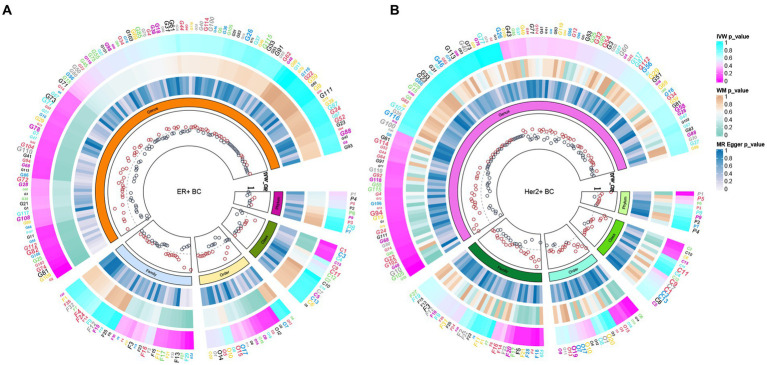
Figure 2.
Based on the ER+ breast cancer cohort of the (A) UKB database and the Her2+ breast cancer cohort of the (B) FinnGen database, the causal relationship between intestinal bacteria and these two subtypes of breast cancer was summarized via MR analysis. The three heatmaps from the outermost circle to the inner circle represent the MR methods IVW, WM, and MR–Egger, respectively. The innermost circle represents the OR calculated by the IVW method. MR, Mendelian randomization; IVW, inverse variance-weighted; UKB, UK Biobank; OR, odds ratio; WM, weighted median; BC, breast cancer.

