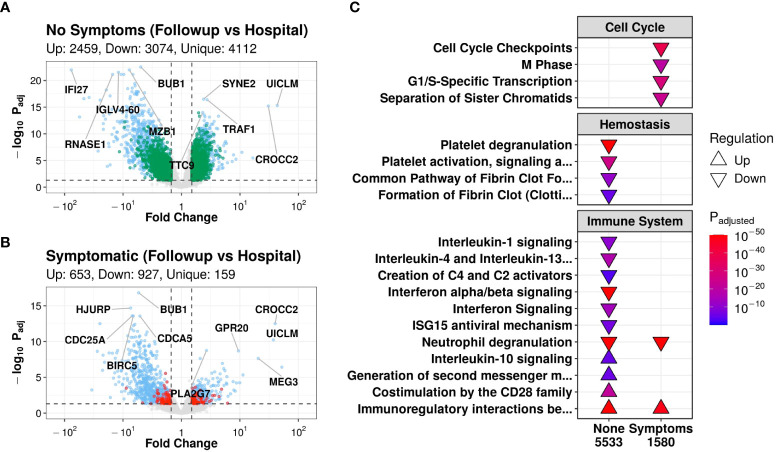
Figure 1.
Patients without symptoms at follow-up had transcriptomic evidence of temporal immune and hemostatic resolution. Volcano plots of differentially expressed (DE) genes over time in patients without (A) and with (B) post-COVID symptoms. Coloured dots indicate DE genes, with green and red dots indicating DE genes that were uniquely DE in asymptomatic vs. symptomatic patients, respectively (blue dots indicate shared DE genes). The top 5 up- and down- regulated genes (lowest adjusted p-value and highest fold change) are labelled. (C): Subset of notable enriched Reactome pathways from DE genes over time in patients who had post-COVID symptoms (“Symptoms”) or who did not have symptoms (“None”) at discharge, with all enriched pathways shown in Figure S2A . Pathways were considered “upregulated” (Δ) if the genes in this pathway were overrepresented in upregulated DE genes when compared to their prevalence in the genome, and vice versa for “downregulated” (∇). P-values were adjusted for multiple comparisons using Bonferroni, with an adjusted p-value cutoff <0.001. The total number of DE genes in each comparison are shown under each label.

