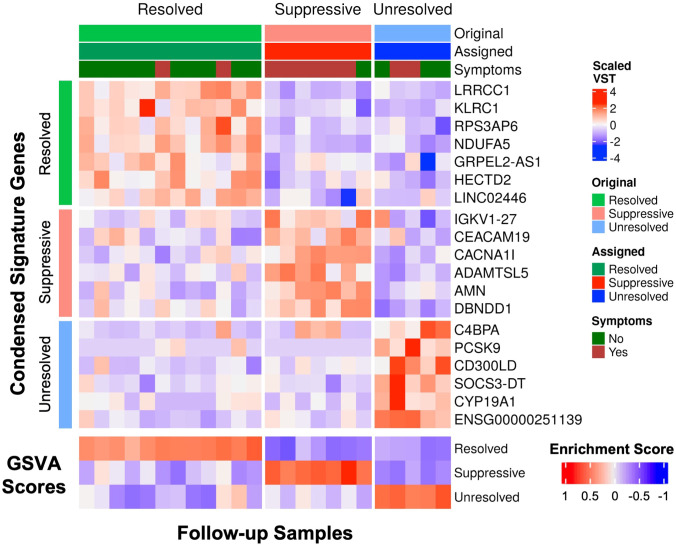
Figure 4.
The condensed gene signatures accurately classified all follow-up samples into one of the three endotypes. The top heatmap displays scaled variance stabilized transformed (VST) counts of the condensed signature genes. The bottom heatmap displays the GSVA enrichment scores of each endotype for each follow-up sample. Samples were assigned to an endotype based on which endotype had the highest gene set variation analysis (GSVA) enrichment score (“Assigned”). The assigned endotypes were identical to the original annotated endotype from K-medoids clustering (“Original”), indicating perfect classification of these samples using these condensed gene signatures.

