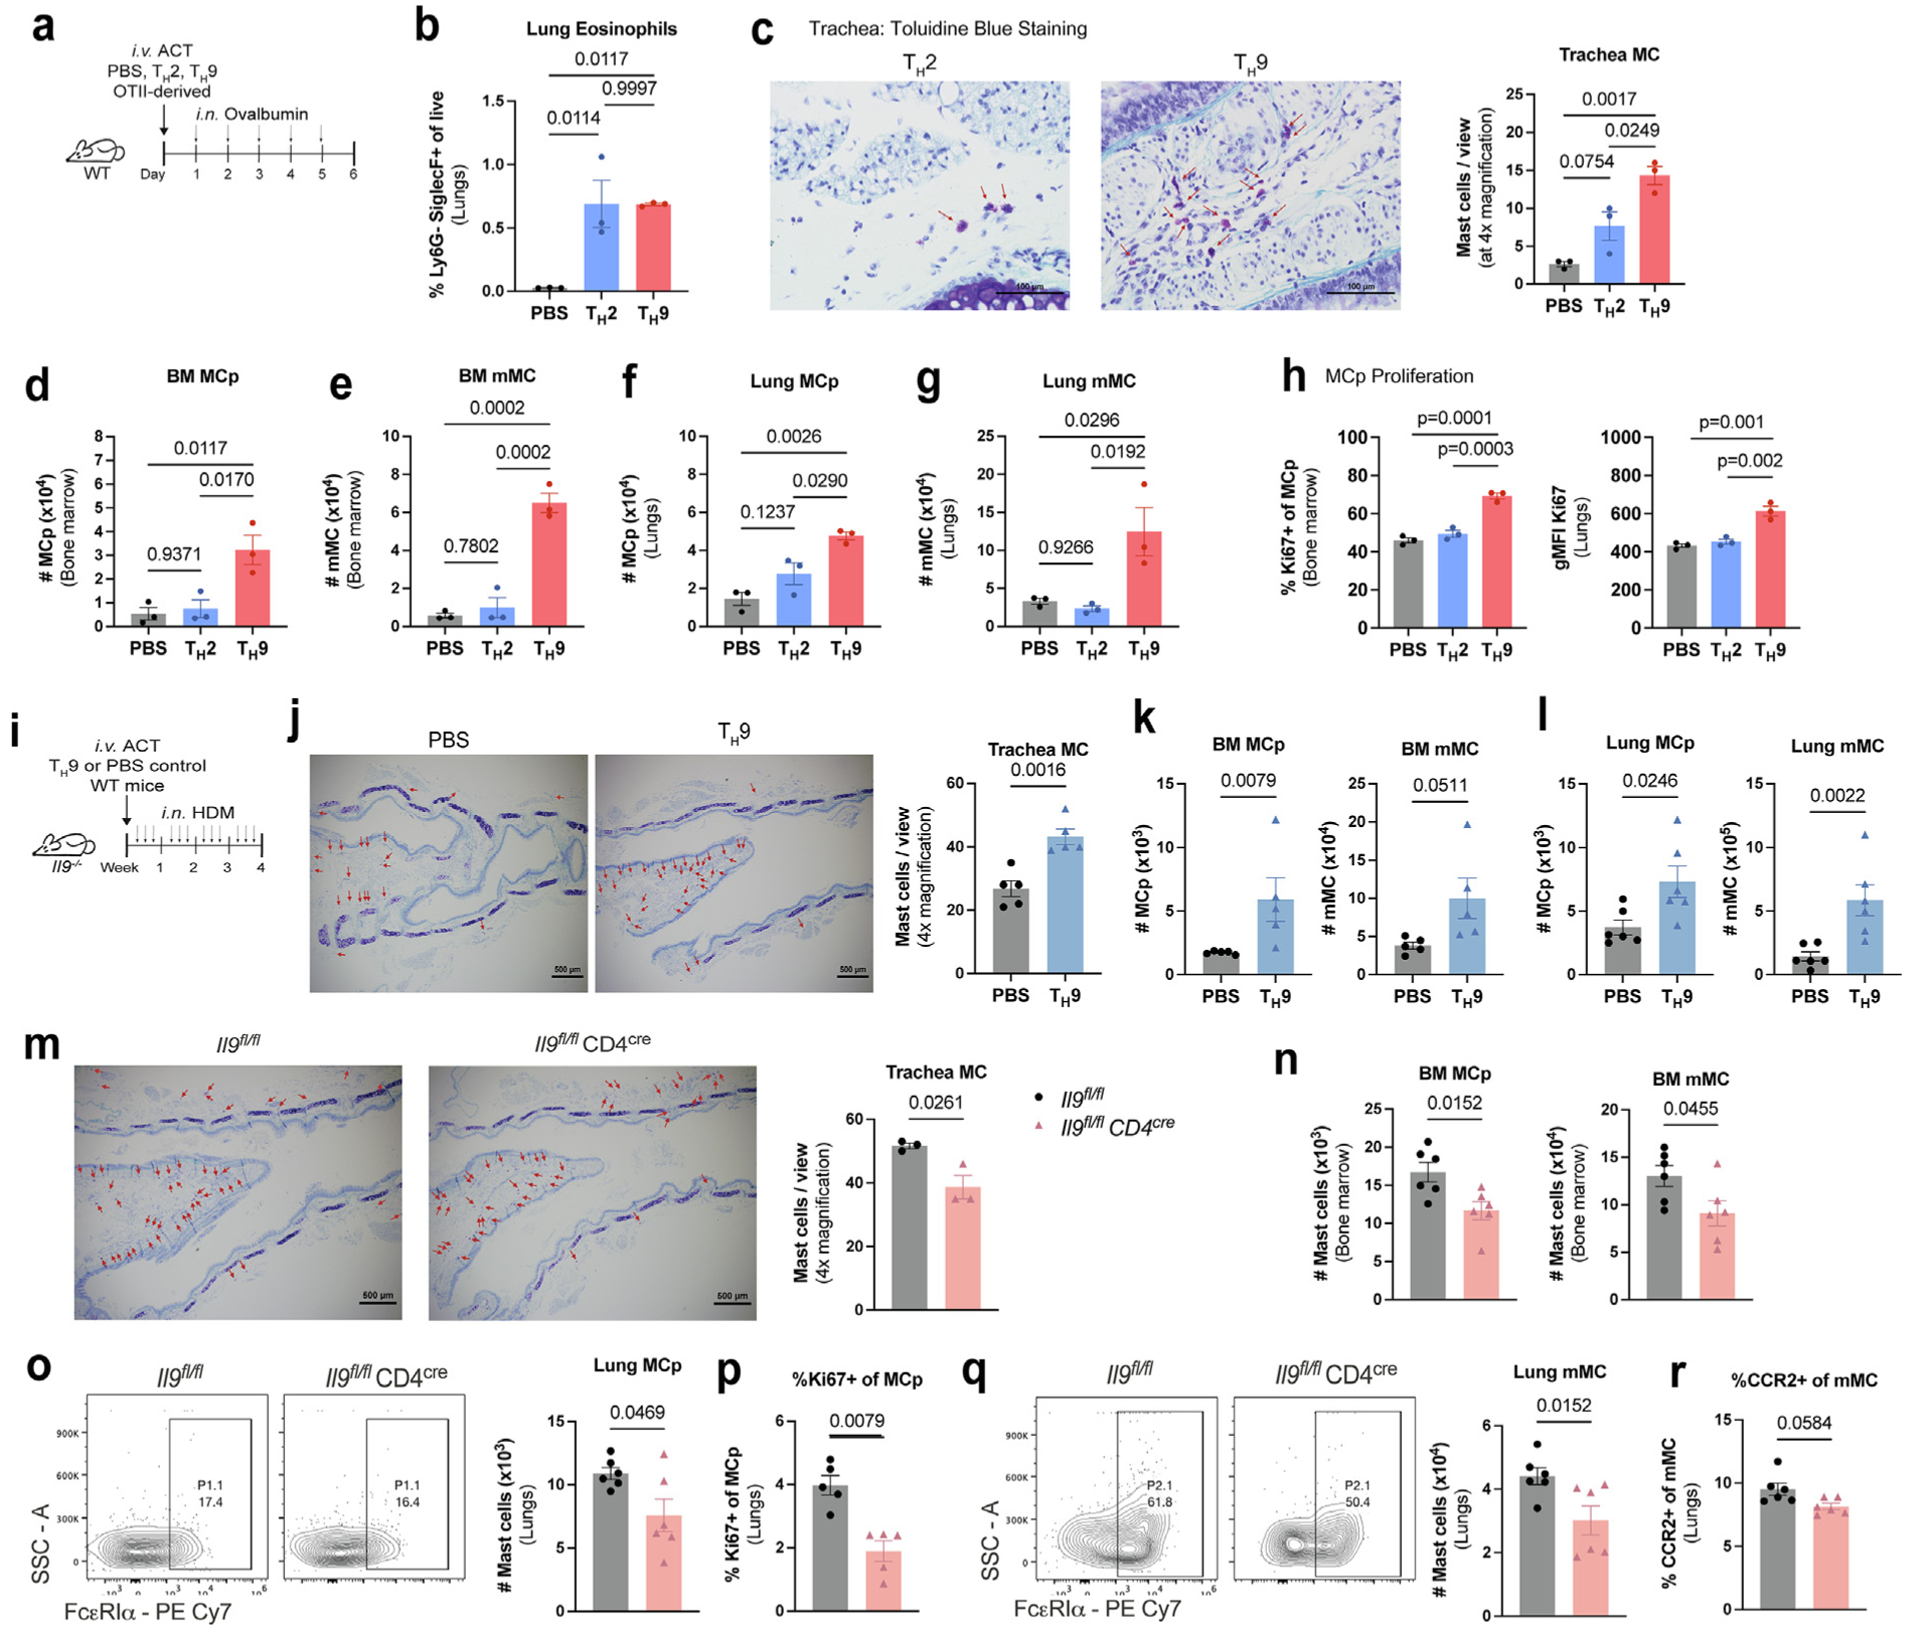
Fig. 5.

T cell IL-9 is a central source of IL-9 mediating MC expansion in the allergic lung. (A–H): A, WT mice transferred with OTII-derived TH2 or TH9 cells were treated with OVA for 5 days; B, lung eosinophil frequencies were determined by flow cytometry. MC numbers were assessed in the trachea (C) using toluidine blue staining and in the bone marrow (D–E) and lungs (F–G) using flow cytometry. (H) Flow cytometry analysis of Ki67 expression in MCp. (n = 3). Data are representative of three independent experiments with similar results. (I–L) WT-derived TH9 cells or PBS were transferred to Il9−/− recipient mice, and subsequently treated with HDM as shown in (I); (J) MC numbers were assessed in the trachea using toluidine blue staining. 4x magnification with Scale = 500 μm. (K–L) Flow cytometry analysis of bone marrow (K) and lung (L) MC numbers (n = 5–6). (M–Q) Il9fl/fl CD4cre mice and littermate controls (Il9fl/fl) were treated with HDM for 6 weeks M, toluidine blue staining of trachea. 4x magnification with Scale = 500 μm; N, flow cytometry analysis of MCs in the bone marrow; O, representative flow cytometry contour plots of lung MCp; P, Ki67 expression in lung MCp; Q, representative flow cytometry contour plots of lung mMC; R, CCR2 expression in lung mMC (n = 6). Data are representative of two independent experiments with similar results. Error bars indicate ± standard error of mean. Statistical significance was determined by analysis of variance, followed by Tukey’s multiple comparison test (B–H) or Mann-Whitney U test (J–R). ACT = adoptive cell transfer; CD = clusters of differentiation; HDM = house dust mite; IL = interleukin; MCp = mast cell progenitors; MCPT 1 = mast cell protease 1; mMC = mature mast cells; ns = not significant; OVA = ovalbumin; PBS = phosphate buffered saline; PE = R-phycoerythrin; SSC = side scatter; TH = T helper; WT, wild type.
