
Figure 8.
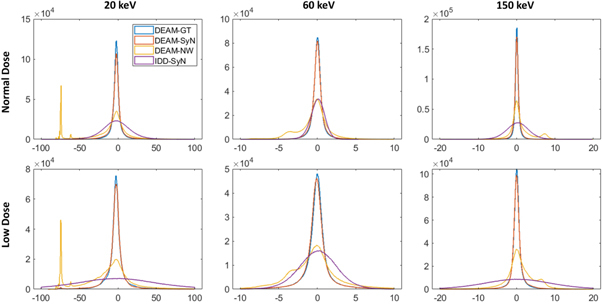
Histograms of percentage errors of LACs reconstructed by different DEAM algorithms against the ground truth (μ GT (x, E) − μ est (x, E)). A higher concentration of values near zero indicates better performance. The distribution tails were truncated to enhance clarity and legibility. The columns from left to right correspond to the estimated LAC at different energies. The first and second rows illustrate the performance of the normal dose and low dose simulation studies, respectively. IDD-SyN denotes the image-domain decomposition results with SyN-estimated DVF. X-axis unit: %.