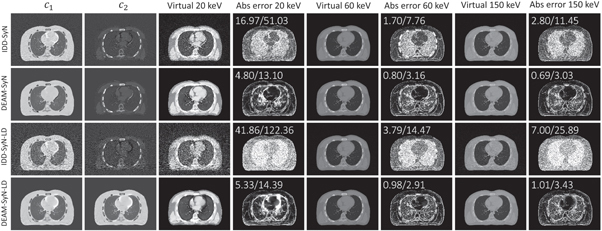
Figure 9.

A representative slice of the reconstructed image. IDD-SyN and DEAM-SyN denote the reconstructed image from the normal dose measurement, and IDD-SyN-LD and DEAM-SyN-LD denote the reconstructed image from the low dose measurement. The numbers in the upper left corner of each error image denote the percentage MAE for extra-lung soft-bony tissue and lung parenchyma, respectively.
