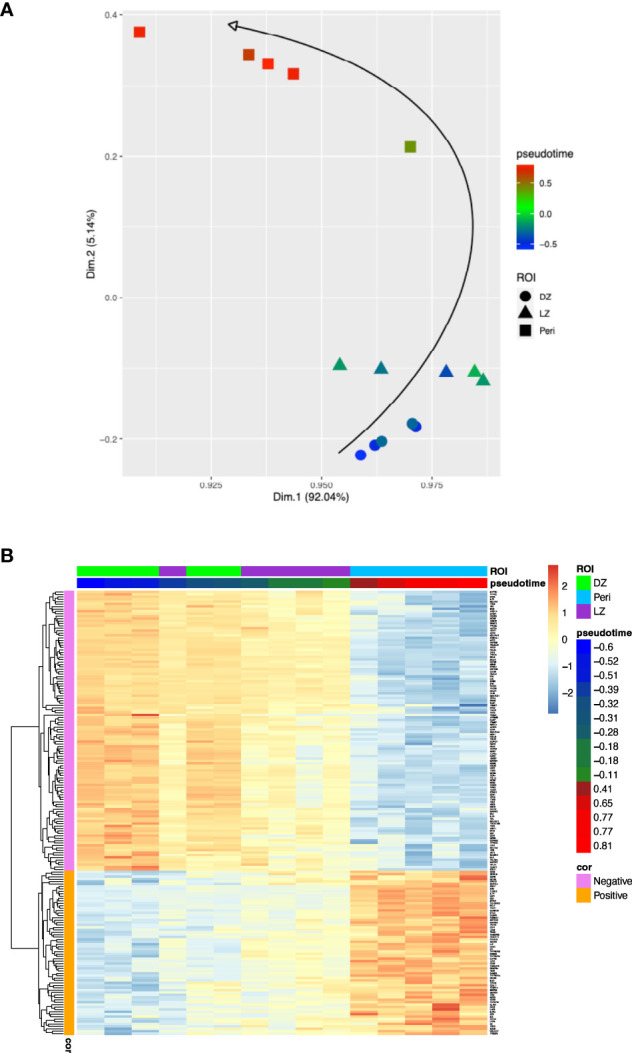
Figure 1.

(A), Two-dimensional principal component projection produces a trajectory among DZ, LZ, and Peri ROIs. The color gradient of points reflects the pseudotime estimated values. (B), Expression heatmap of the 184 genes significantly correlated with the pseudotime over 15 ROIs. The 15 ROIs (columns) are ordered according to the pseudotime estimation.
