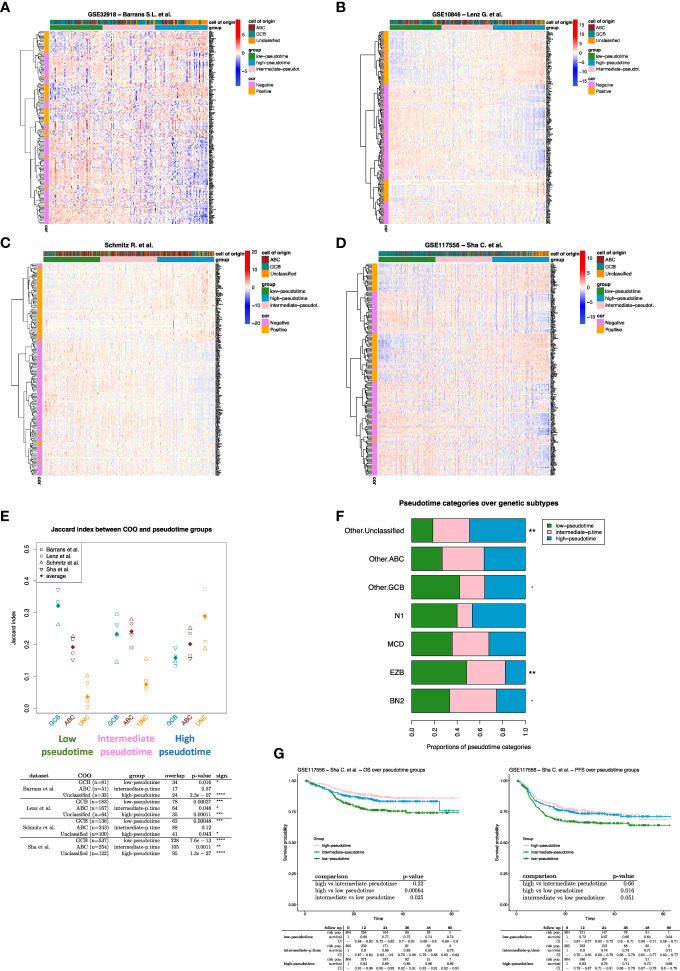
Figure 2.
(A-D) Expression heatmap of the 184 pseudotime-related genes. The DLBCL cases (columns) are ordered according to their pseudotime-related score (see methods). Three pseudotime groups have been identified by applying the tertile separation on pseudotime-related scores (i.e., low, intermediate, and high pseudotime groups). (E) Jaccard similarity index between COO and pseudotime groups over DLBCL datasets. Unclassified cases strongly enrich all the high-pseudotime groups. While GCB cases enrich all the low-pseudotime groups (Fisher p-values are shown in the table). (F) Proportions of pseudotime categories over genetic subtype groups. The Fisher exact test has been applied to evaluate the association between genetic subtypes and pseudotime categories ( Supplementary Table 4 ). “Other.ABC,” “Other.GCB,” and “Other.Unclassified” are cases that lack genetic subtype classification and only have COO classification. (G) Survival analysis on DLBCL cases from Sha et al. dataset. Patients were divided into three groups according to the tertiles of their pseudotime-related scores (i.e., low, intermediate, and high pseudotime groups). if p-value < 0.1 *; if p-value < 0.05; ** if p-value < 0.01; *** if p-value < 0.001; **** if p-value < 0.0001.

