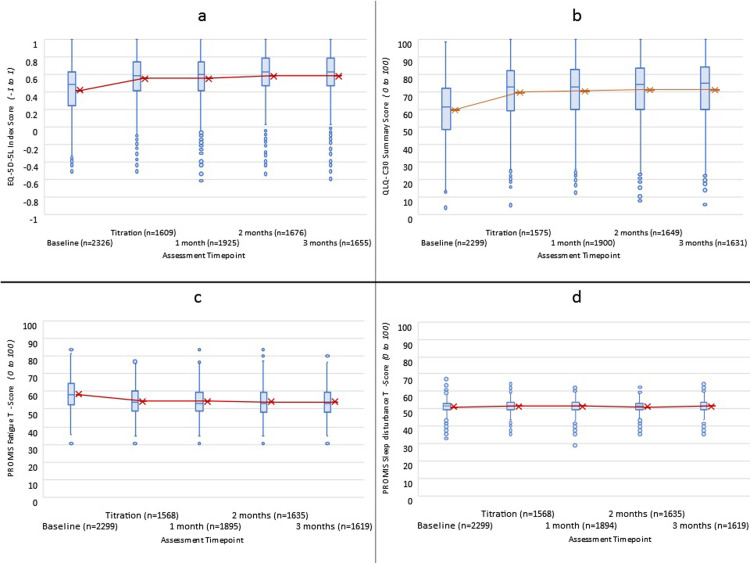
Fig 2.
Score distribution (blue) and mean trends (red) from baseline to 3-months following titration for a) EQ-5D-5L Australian weighted Index Scores, b) QLQ-C30 Summary Scores, c) PROMIS-Fat T-scores, and d) PROMIS Sleep disturbance T-scores. Higher scores indicate better quality of life (a & b). Higher scores indicate worse symptom burden (c & d).

