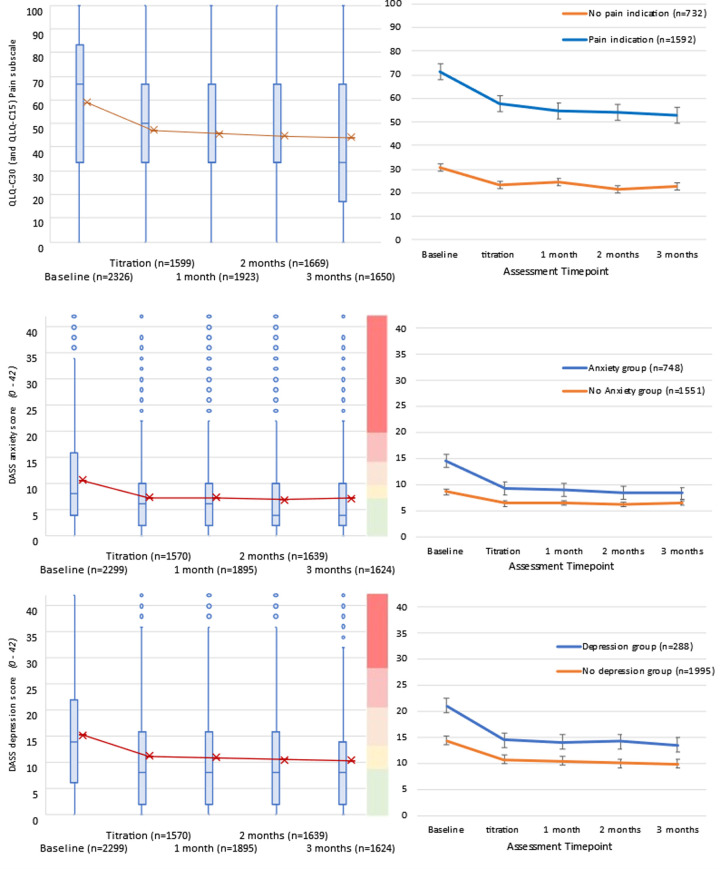
Fig 3. Score distribution and group comparisons of mean scores for Pain, Anxiety, and Depression from baseline to 3-months following titration.
Higher scores indicate greater symptom burden. Pain group includes participants with any diagnosed pain condition (listed in Appendix B). Anxiety group includes participants diagnosed with generalized anxiety disorder or mixed depressive and anxiety disorder. Depression group includes participants diagnosed with recurrent depressive disorder, mixed depressive and anxiety disorder, or bipolar disorder.

