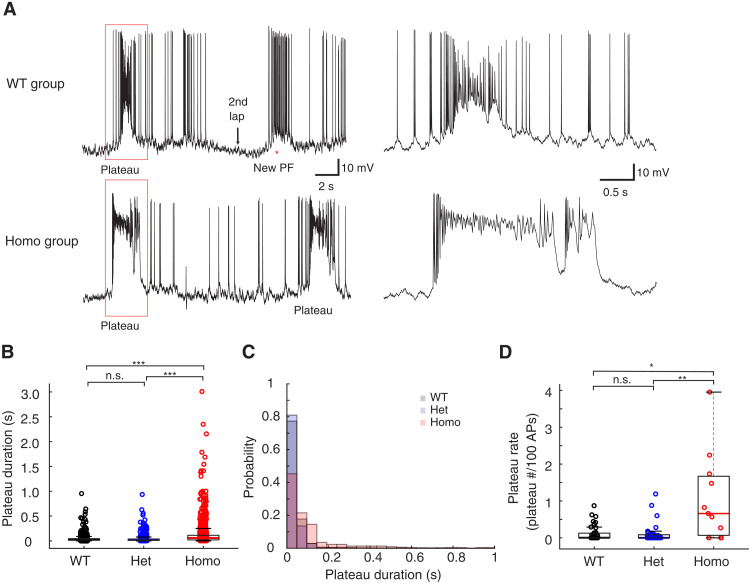
Fig. 5. Cellular excitability comparison between WT and CaMKII T286A mutant neurons from in vivo recordings.
(A) Example traces of the WT group (top) and the Homo group (bottom). (B) Quantification of the plateau potential duration in three groups. All plateau potential events with a peak voltage that is more depolarized than −35 mV are used for analysis. Permutation test, Hedge’s g value: 0.02 (WT versus Het), −0.60 (WT versus Homo), and −0.52 (Het versus Homo). P = 0.254 (WT versus Het), 3.33 × 10⁻⁵ (WT versus Homo), and 3.33 × 10⁻⁵ (Het versus Homo); n = 1650, 964, and 989 for each group, respectively. (C) The distribution of the duration of all the plateau potentials. The Homo group has longer duration plateau potentials. (D) Quantification of the plateau potential rate. Plateau rate is defined as the number of plateau potentials occurring for every 100 single (non-plateau) APs as described previously (32). Only plateau potentials with more than 50-ms duration were quantified. H = 9.79, P = 0.0075 for the Kruskal-Wallis test. Z = 0.681 (WT versus Het), −2.75 (WT versus Homo), and −2.93 (Het versus Homo). P = 0.900 (WT versus Het), 0.0212 (WT versus Homo), and 0.00586 (Het versus Homo). Kruskal-Wallis test with Dunn’s test for multiple comparisons was used in (D). Permutation test with Bonferroni correction was conducted in (B). *P < 0.05, **P < 0.01, and ***P < 0.001; n.s. (P ≥ 0.05). Sample sizes: n = 39 (WT) from 24 mice, n = 38 (Het) from 26 mice, and n = 11 (Homo) from 7 mice.

