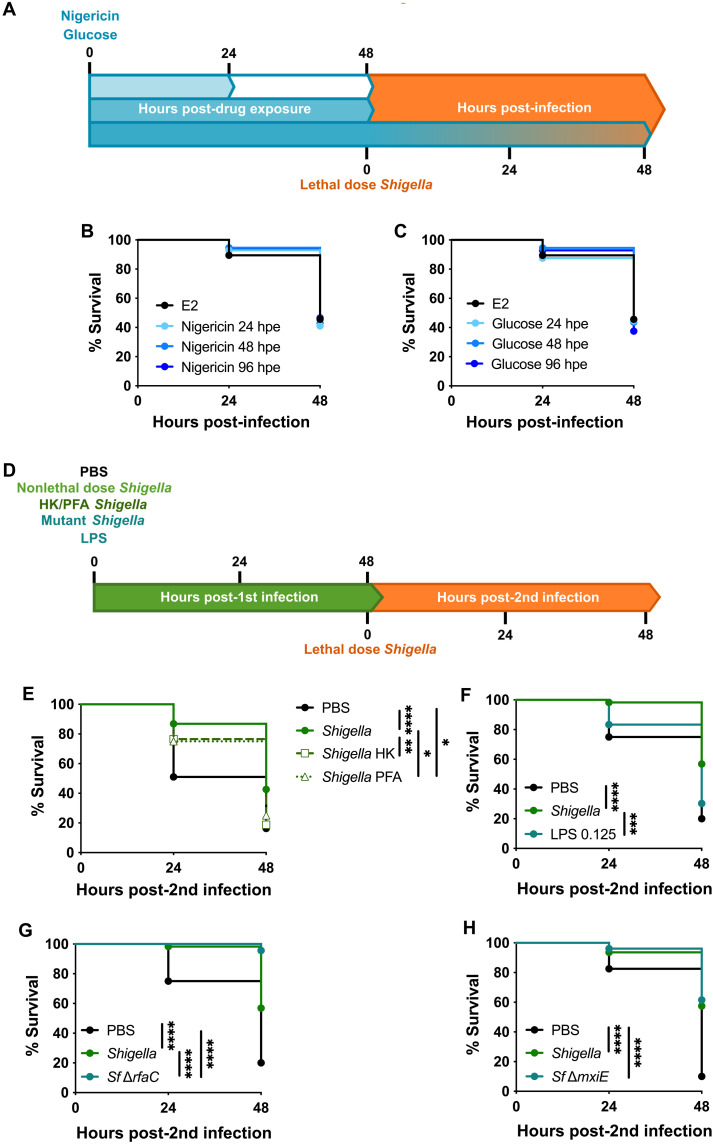
Fig. 4. Shigella stimulates inflammatory pathways to induce training.
(A) Exposure of zebrafish larvae to nigericin and glucose followed by Shigella infection. (B) Survival curves from E2- and nigericin (0.1 μM)–treated larvae infected with Shigella (PBS, 2.7 × 10⁴ ± 8.5 × 10³ CFUs; nigericin, 2.6 × 10⁴ ± 4.1 × 10³ CFUs). N = 3 with >14 larvae per experiment. hpe, hours post-drug exposure (C) Survival curves from E2- and glucose (1%)–treated larvae infected with Shigella (PBS, 2.7 × 10⁴ ± 8.5 × 10³ CFUs; glucose, 2.7 × 10⁴ ± 1 × 10⁴ CFUs). N = 3 with >14 larvae per experiment. (D) Reinfection of larvae trained with nonlethal dose of live or killed Shigella, Shigella mutants, or LPS followed by infection with Shigella at 4 dpf. (E) Survival curves from naïve, live-Shigella–trained (1.3 × 10³ ± 6.6 × 10² CFUs), Shigella heat-killed (HK)–trained, and Shigella PFA–trained larvae infected with Shigella (PBS, 2.7 × 10⁴ ± 6.1 × 10³ CFUs; Shigella, 2.7 × 10⁴ ± 1 × 10⁴ CFUs; Shigella HK, 3.2 × 10⁴ ± 3.3 × 10⁴ CFUs; Shigella PFA, 3.2 × 10⁴ ± 1.7 × 10⁴ CFUs). N = 3 with >11 larvae per experiment. (F) Survival curves from naïve Shigella-trained (1.6 × 10³ ± 6.5 × 10² CFUs) and LPS-primed (0.125 ng) larvae infected with Shigella (PBS, 1.9 × 10⁴ ± 6.3 × 10³ CFUs; Shigella, 2.8 × 10⁴ ± 4.7 × 10³ CFUs; LPS, 1.9 × 10⁴ ± 9.1 × 10³ CFUs). N = 3 with >18 larvae per experiment. (G) Survival curves from naïve, Shigella-trained (1.6 × 10³ ± 6.5 × 10² CFUs), and Shigella ΔrfaC–trained (8.5 × 10² ± 7.5 × 10² CFUs) larvae infected with Shigella (PBS, 1.9 × 10⁴ ± 6.3 × 10³ CFUs; Shigella, 2.8 × 10⁴ ± 4.7 × 10³ CFUs; ΔrfaC, 2.4 × 10⁴ ± 8.4 × 10³ CFUs). N = 3 with >10 larvae per experiment. (H) Survival curves from naïve, Shigella-trained (7.9 × 10² ± 5.5 × 10² CFUs) and Shigella ΔmxiE–trained (8.8 × 10² ± 5.8 × 10² CFUs) larvae infected with Shigella (PBS, 1.9 × 10⁴ ± 7.5 × 10³ CFUs; Shigella, 2.5 × 10⁴ ± 4.6 × 10³ CFUs; ΔmxiE, 2.2 × 10⁴ ± 7.6 × 10³ CFUs). N = 3 with >10 larvae per experiment. *P < 0.05, **P < 0.01, ***P < 0.001, ****P < 0.0001, log-rank (Mantel-Cox) test (B, C, E, F, G, and H).

