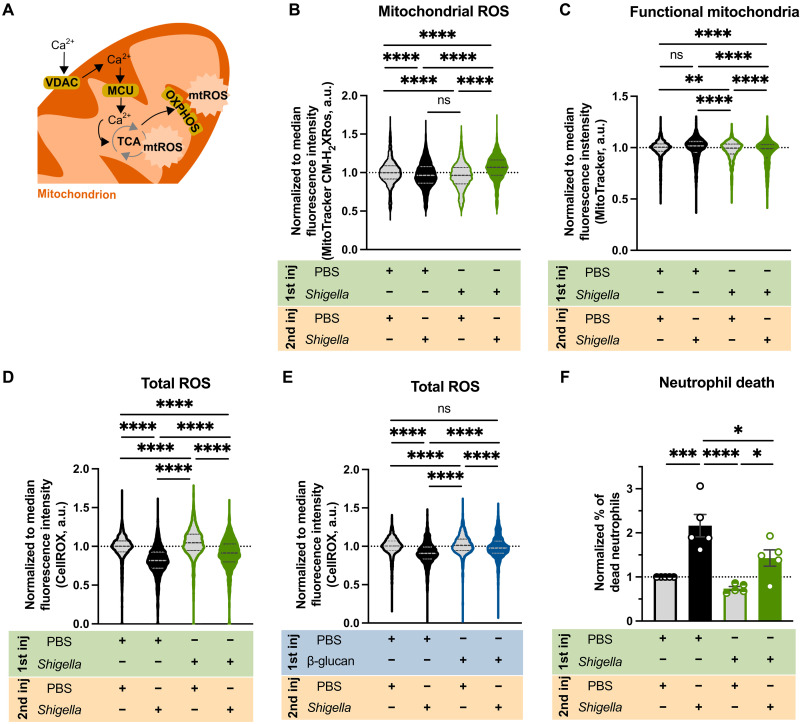
Fig. 6. Trained neutrophils produce more mtROS.
(A) Increased calcium transportation via VDAC and MCU increases mtROS. (B) Normalized fluorescence of MitoTracker Red CM-H2XRos in neutrophils from naïve and Shigella-trained (1.2 × 10³ ± 5.3 × 10² CFUs) larvae [Tg(mpx::GFP)] unstimulated or infected with Shigella (PBS, 2.6 × 10⁴ ± 9.3 × 10³ CFUs; Shigella, 3 × 10⁴ ± 6.6 × 10³ CFUs) at 6 hp2i. N = 3 with >10 larvae per experiment (mean ± SD). (C) Normalized fluorescence of MitoTracker Deep Red in neutrophils from naïve and Shigella-trained (1.8 × 10³ ± 1 × 10³ CFUs) larvae [Tg(mpx::GFP)] unstimulated or infected with Shigella (PBS, 2.1 × 10⁴ ± 1.1 × 10⁴ CFUs; Shigella, 1.9 × 10⁴ ± 8.3 × 10³ CFUs) at 6 hp2i. N = 3 with 30 larvae per experiment (mean ± SD). (D) Normalized fluorescence of CellROX Deep Red in neutrophils from naïve and Shigella-trained (1.4 × 10³ ± 6.7 × 10² CFUs) larvae [Tg(mpx::GFP)] unstimulated or infected with Shigella (PBS, 2.6 × 10⁴ ± 1 × 10⁴ CFUs; Shigella, 2.6 × 10⁴ ± 1 × 10⁴ CFUs) at 6 hp2i. N = 3 with >10 larvae per experiment (mean ± SD). (E) Normalized fluorescence of CellROX Deep Red in neutrophils from naïve and β-glucan–trained larvae [Tg(mpx::GFP)] unstimulated or infected with a lethal dose of Shigella flexneri M90T (PBS, 2 × 10⁴ ± 1.3 × 10⁴ CFUs; β-glucan, 2.7 × 10⁴ ± 9.8 × 10³ CFUs) at 6 hp2i. N = 3 with >20 larvae per experiment (mean ± SD). (F) Normalized percentage of dead neutrophils (LIVE/DEAD Fixable Violet Stain) from naïve and Shigella-trained larvae [Tg(mpx::GFP)] unstimulated or infected with Shigella at 6 hp2i. N = 5 with >10 larvae per experiment (mean ± SD). *P < 0.05, ***P < 0.001, ****P < 0.0001, one-way ANOVA with Tukey’s multiple comparisons test (B, C, D, and E). a.u., arbitrary units.

