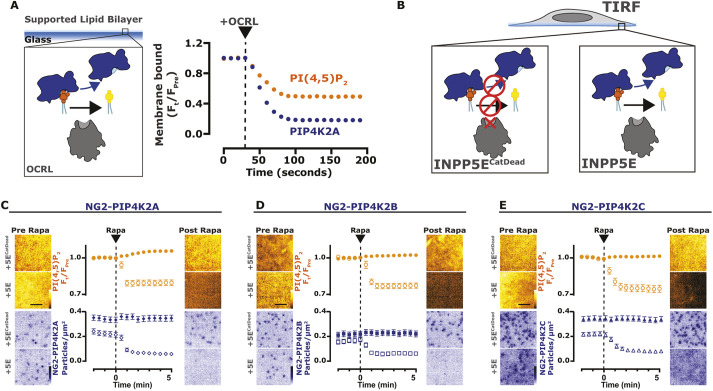
Fig. 4.
PI(4,5)P2 is necessary for the PM localization of PIP4K. (A) Depletion of PI(4,5)P2 causes PIP4K2A to dissociate from SLBs. Imaging chambers containing 50 nM PIP4K2A and 20 nM PH-PLCδ1 at equilibrium with SLBs composed of 96% DOPC and 4% PI(4,5)P2 were visualized by TIRF microscopy. At 30 s, 100 nM OCRL was added to catalyze the dephosphorylation of PI(4,5)P2 and membrane dissociation of PIP4K2A and PH-PLCδ1. (B) Depletion of PI(4,5)P2 causes NG2–PIP4K2C to dissociate from the membrane. Cartoons show the CID system, in TIRFM, for FKBP-tagged INPP5E (catalytically active or dead) dimerizing with the PM-anchored Lyn11–FRB. (C) Depletion of PI(4,5)P2 causes NG2–PIP4K2A to dissociate from the membrane. NG2–PIP4K2A (blue) cells were transfected with FKBP-tagged proteins, the high affinity PI(4,5)P2 indicator TubbyC (orange) and Lyn11-FRB. During time-lapse TIRF microscopy, cells were stimulated with 1 µM Rapa, as indicated. TubbyC traces represent mean±s.e.m. change in fluorescence intensity (Ft/Fpre) The NG2–PIP4K2A traces represent the mean±s.e.m. change in puncta per µm2. A total of 29–32 cells were imaged across three independent experiments. (D) Depletion of PI(4,5)P2 causes NG2–PIP4K2B to dissociate from the membrane. As in C, NG2–PIP4K2B (blue) cells were transfected with FKBP-tagged proteins, TubbyC (orange) and Lyn11–FRB; cells were stimulated with 1 µM Rapa, as indicated. TubbyC traces represent mean±s.e.m. change in fluorescence intensity (Ft/Fpre). The NG2–PIP4K2B traces represent the mean±s.e.m. change in puncta per µm2. A total of >32 cells were imaged across three independent experiments. (E) Depletion of PI(4,5)P2 causes NG2–PIP4K2C to dissociate from the membrane. As in C, NG2–PIP4K2C (blue) cells were transfected with FKBP-tagged proteins, TubbyC (orange) and Lyn11–FRB; cells were stimulated with 1 µM Rapa, as indicated. TubbyC traces represent mean±s.e.m. change in fluorescence intensity (Ft/Fpre). The NG2–PIP4K2C traces represent the mean±s.e.m. change in puncta per µm2. A total of >38 cells were imaged across three independent experiments. Scale bars: 2.5 µm.

