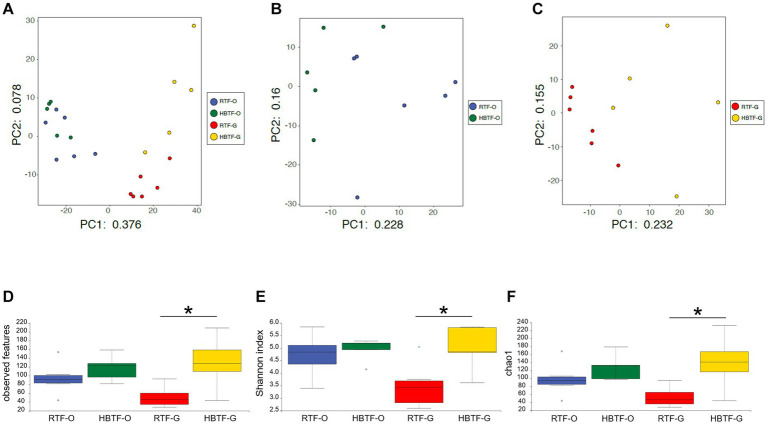
Figure 2.
Evaluation of oral and gut microbiome compositions based on 16S rRNA gene sequences between RTF and HBTF participants (n = 6 and 5, respectively). PCA analysis (A) in the oral and gut microbiome between RTF and HBTF participants, (B) in the oral microbiome between RTF and HBTF participants, and (C) in the gut microbiome between RTF and HBTF participants. (D) Number of observed features, (E) Shannon index, (F) Chao1 among oral and gut microbiome between RTF and HBTF participants. RTF, ready-made tube feeding; HBTF, homemade blenderized tube feeding; RTF-O, oral microbiome in the participants with RTF; HBTF-O, oral microbiome in the participants with HBTF; RTF-G, gut microbiome in the participants with RTF; HBTF-G, gut microbiome in the participants with HBTF. *p < 0.05.

