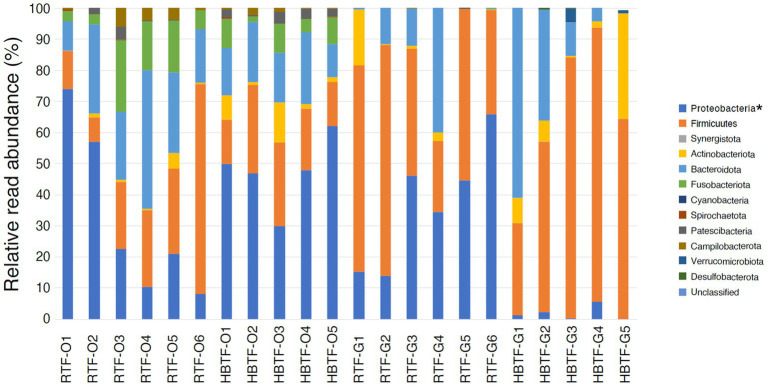
Figure 3.
Evaluation of oral and gut microbiome compositions based on 16S rRNA gene sequences between RTF and HBTF participants at the phylum level (n = 6 and 5, respectively). * > W0.7 in gut microbial composition between RTF and HBTF participants. RTF, ready-made tube feeding; HBTF, homemade blenderized tube feeding; RTF-O, oral microbiome in the participants with RTF; HBTF-O, oral microbiome in the participants with HBTF; RTF-G, gut microbiome in the participants with RTF; HBTF-G, gut microbiome in the participants with HBTF.

