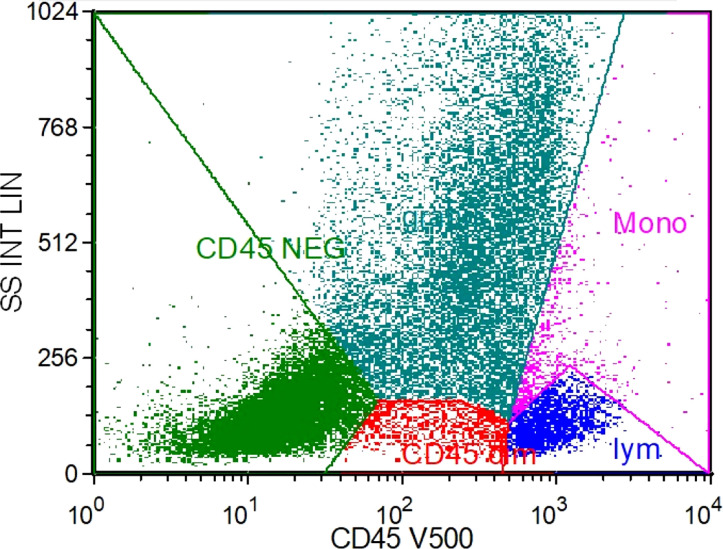
Figure 2.
Flow cytometry immunofluorescence analysis results. Y-axis: lateral scattering intensity linear (SS INT LIN); X-axis: the account of CD45 detected by optical filter centered near 500 nm. The dark green color represents granulocyte, the purple color represents monocytes, the red color represents weak expressing CD45 cells, and the light green represents CD45 negative cells.

