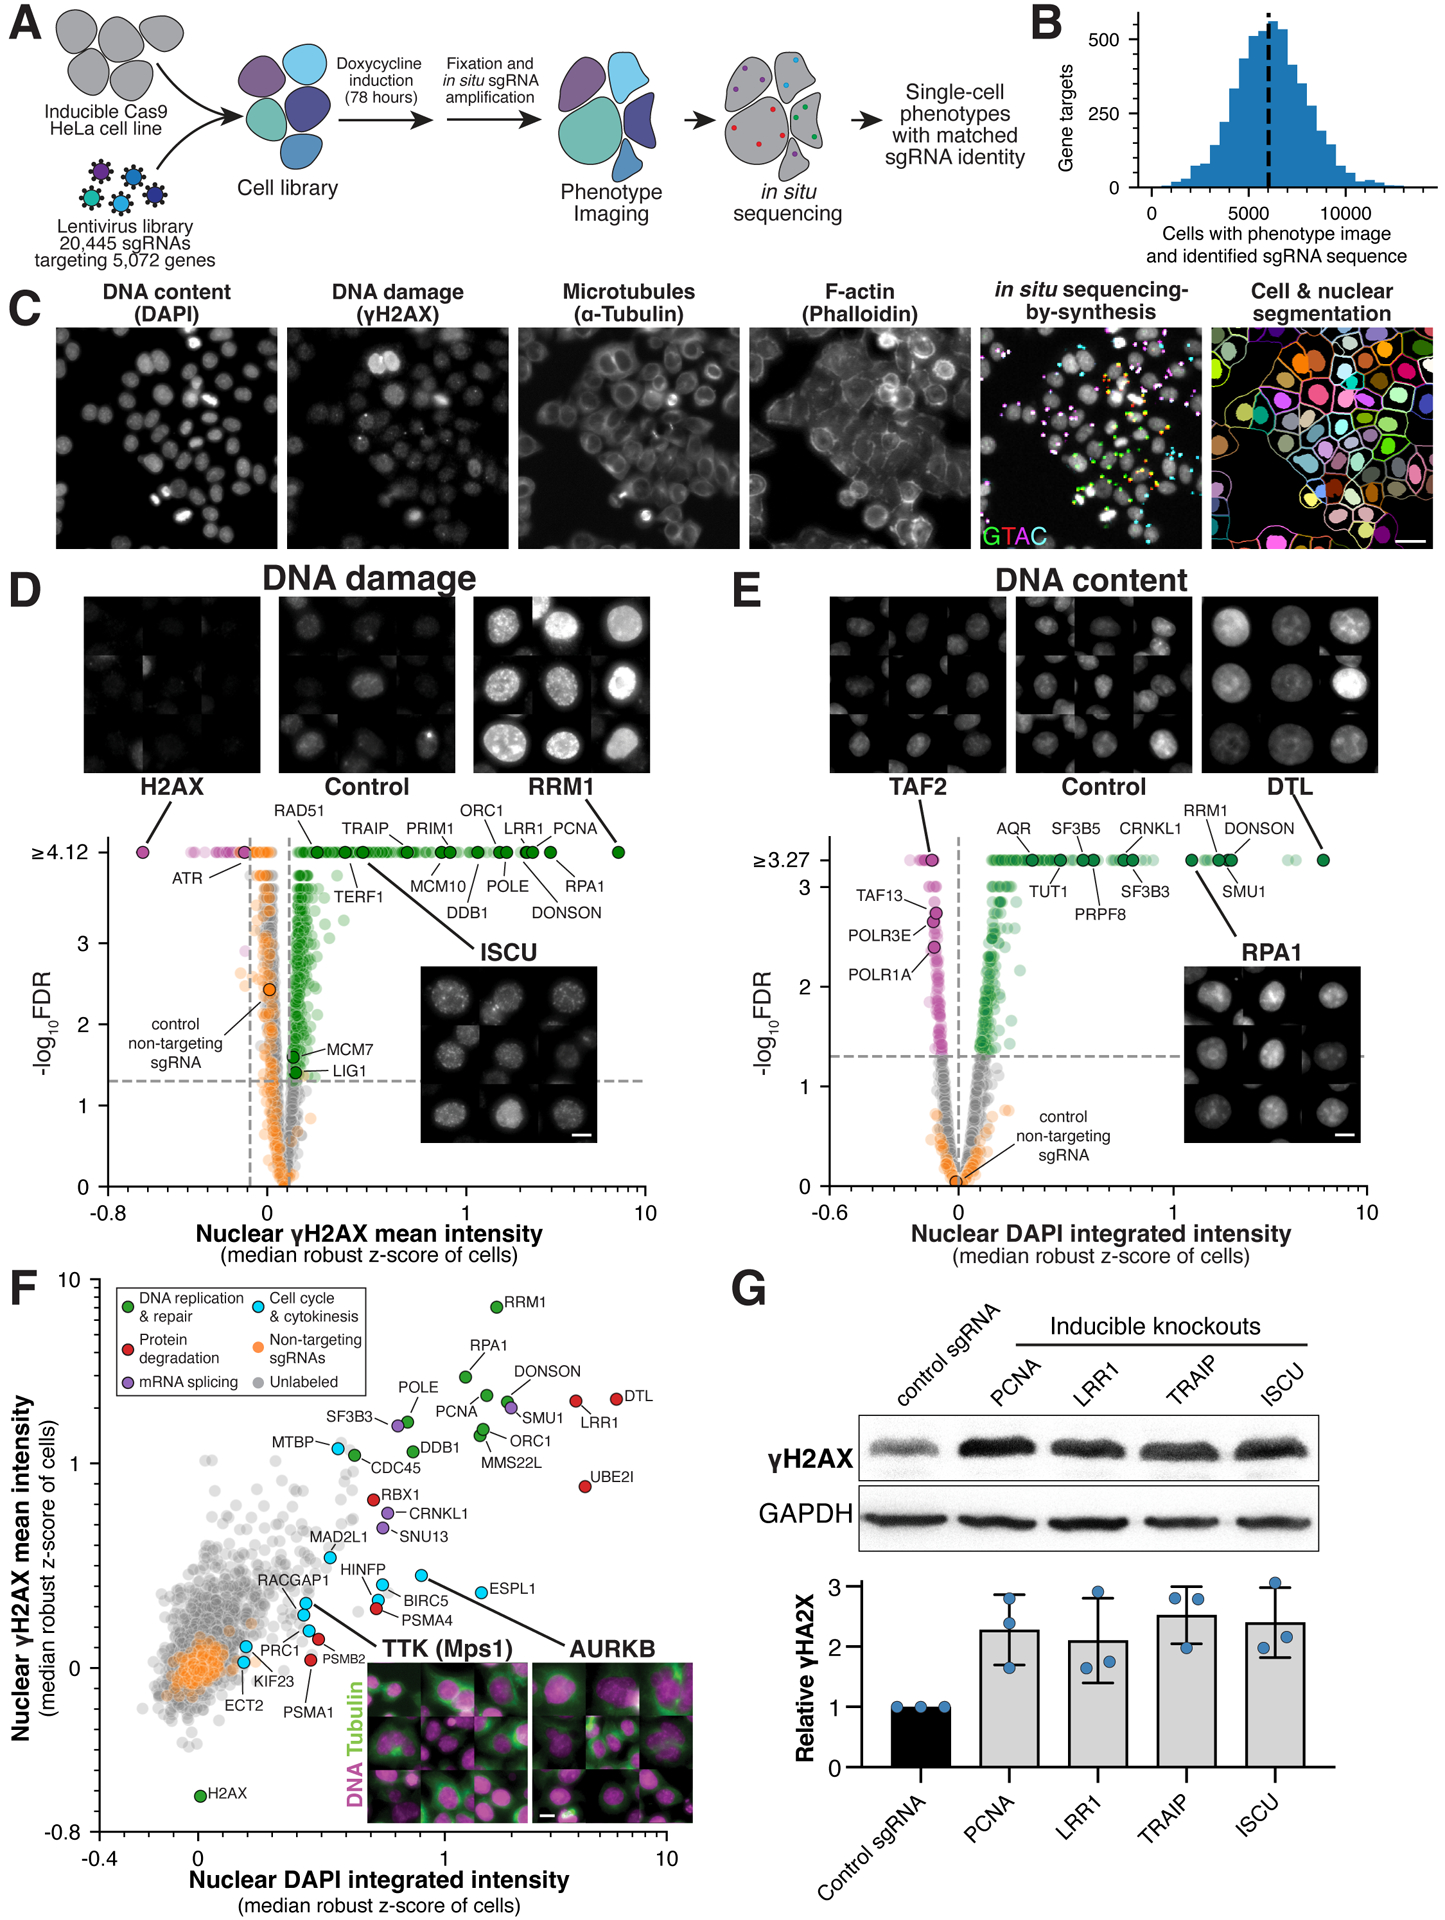
Figure 1. Large-scale image-based pooled CRISPR screen identifies essential genes with roles in genome integrity.

(A) Workflow for image-based pooled CRISPR screen (also see STAR Methods). (B) Histogram showing the number of cells analyzed for each gene target with image and single sgRNA sequence mapped. (C) Example image from the pooled screen showing the indicated stains together with fluorescent in situ sequencing (Laplacian-of-Gaussian filtered) and cell segmentation. Scale bar, 25 μm. (D) Volcano plot for mean nuclear γH2AX intensity across gene targets and selected images to highlight specific targets whose knockout results in increased (green) or decreased (magenta) γH2AX relative to random samples of cells expressing targeting sgRNAs (orange; FDR<0.05; STAR Methods). The median robust z-score is calculated relative to cells expressing non-targeting sgRNAs and is plotted on a symmetric log scale (linear between −1 and 1). Scale bar, 10 μm. (E) Volcano plot and selected images as in (D) for changes in integrated nuclear DAPI intensity relative to random samples of cells expressing non-targeting sgRNAs (STAR Methods). Scale bar, 10 μm. (F) Scatter plot comparing the relationship between DNA damage and content. Labeled genes are colored by functional category. Example images show tubulin (green) and DNA (magenta) to highlight multinucleated cells. Scale bar, 10 μm. (G) Western blot (top) and quantification (bottom) confirming the presence of increased DNA damage in individual knockout cell lines targeting either the indicated genes or a single copy locus control. Blue data points indicate independent replicates. For each sample, γH2AX intensity was referenced to its GAPDH loading control and normalized by negative control γH2AX relative intensity. Error bars indicate SD.
