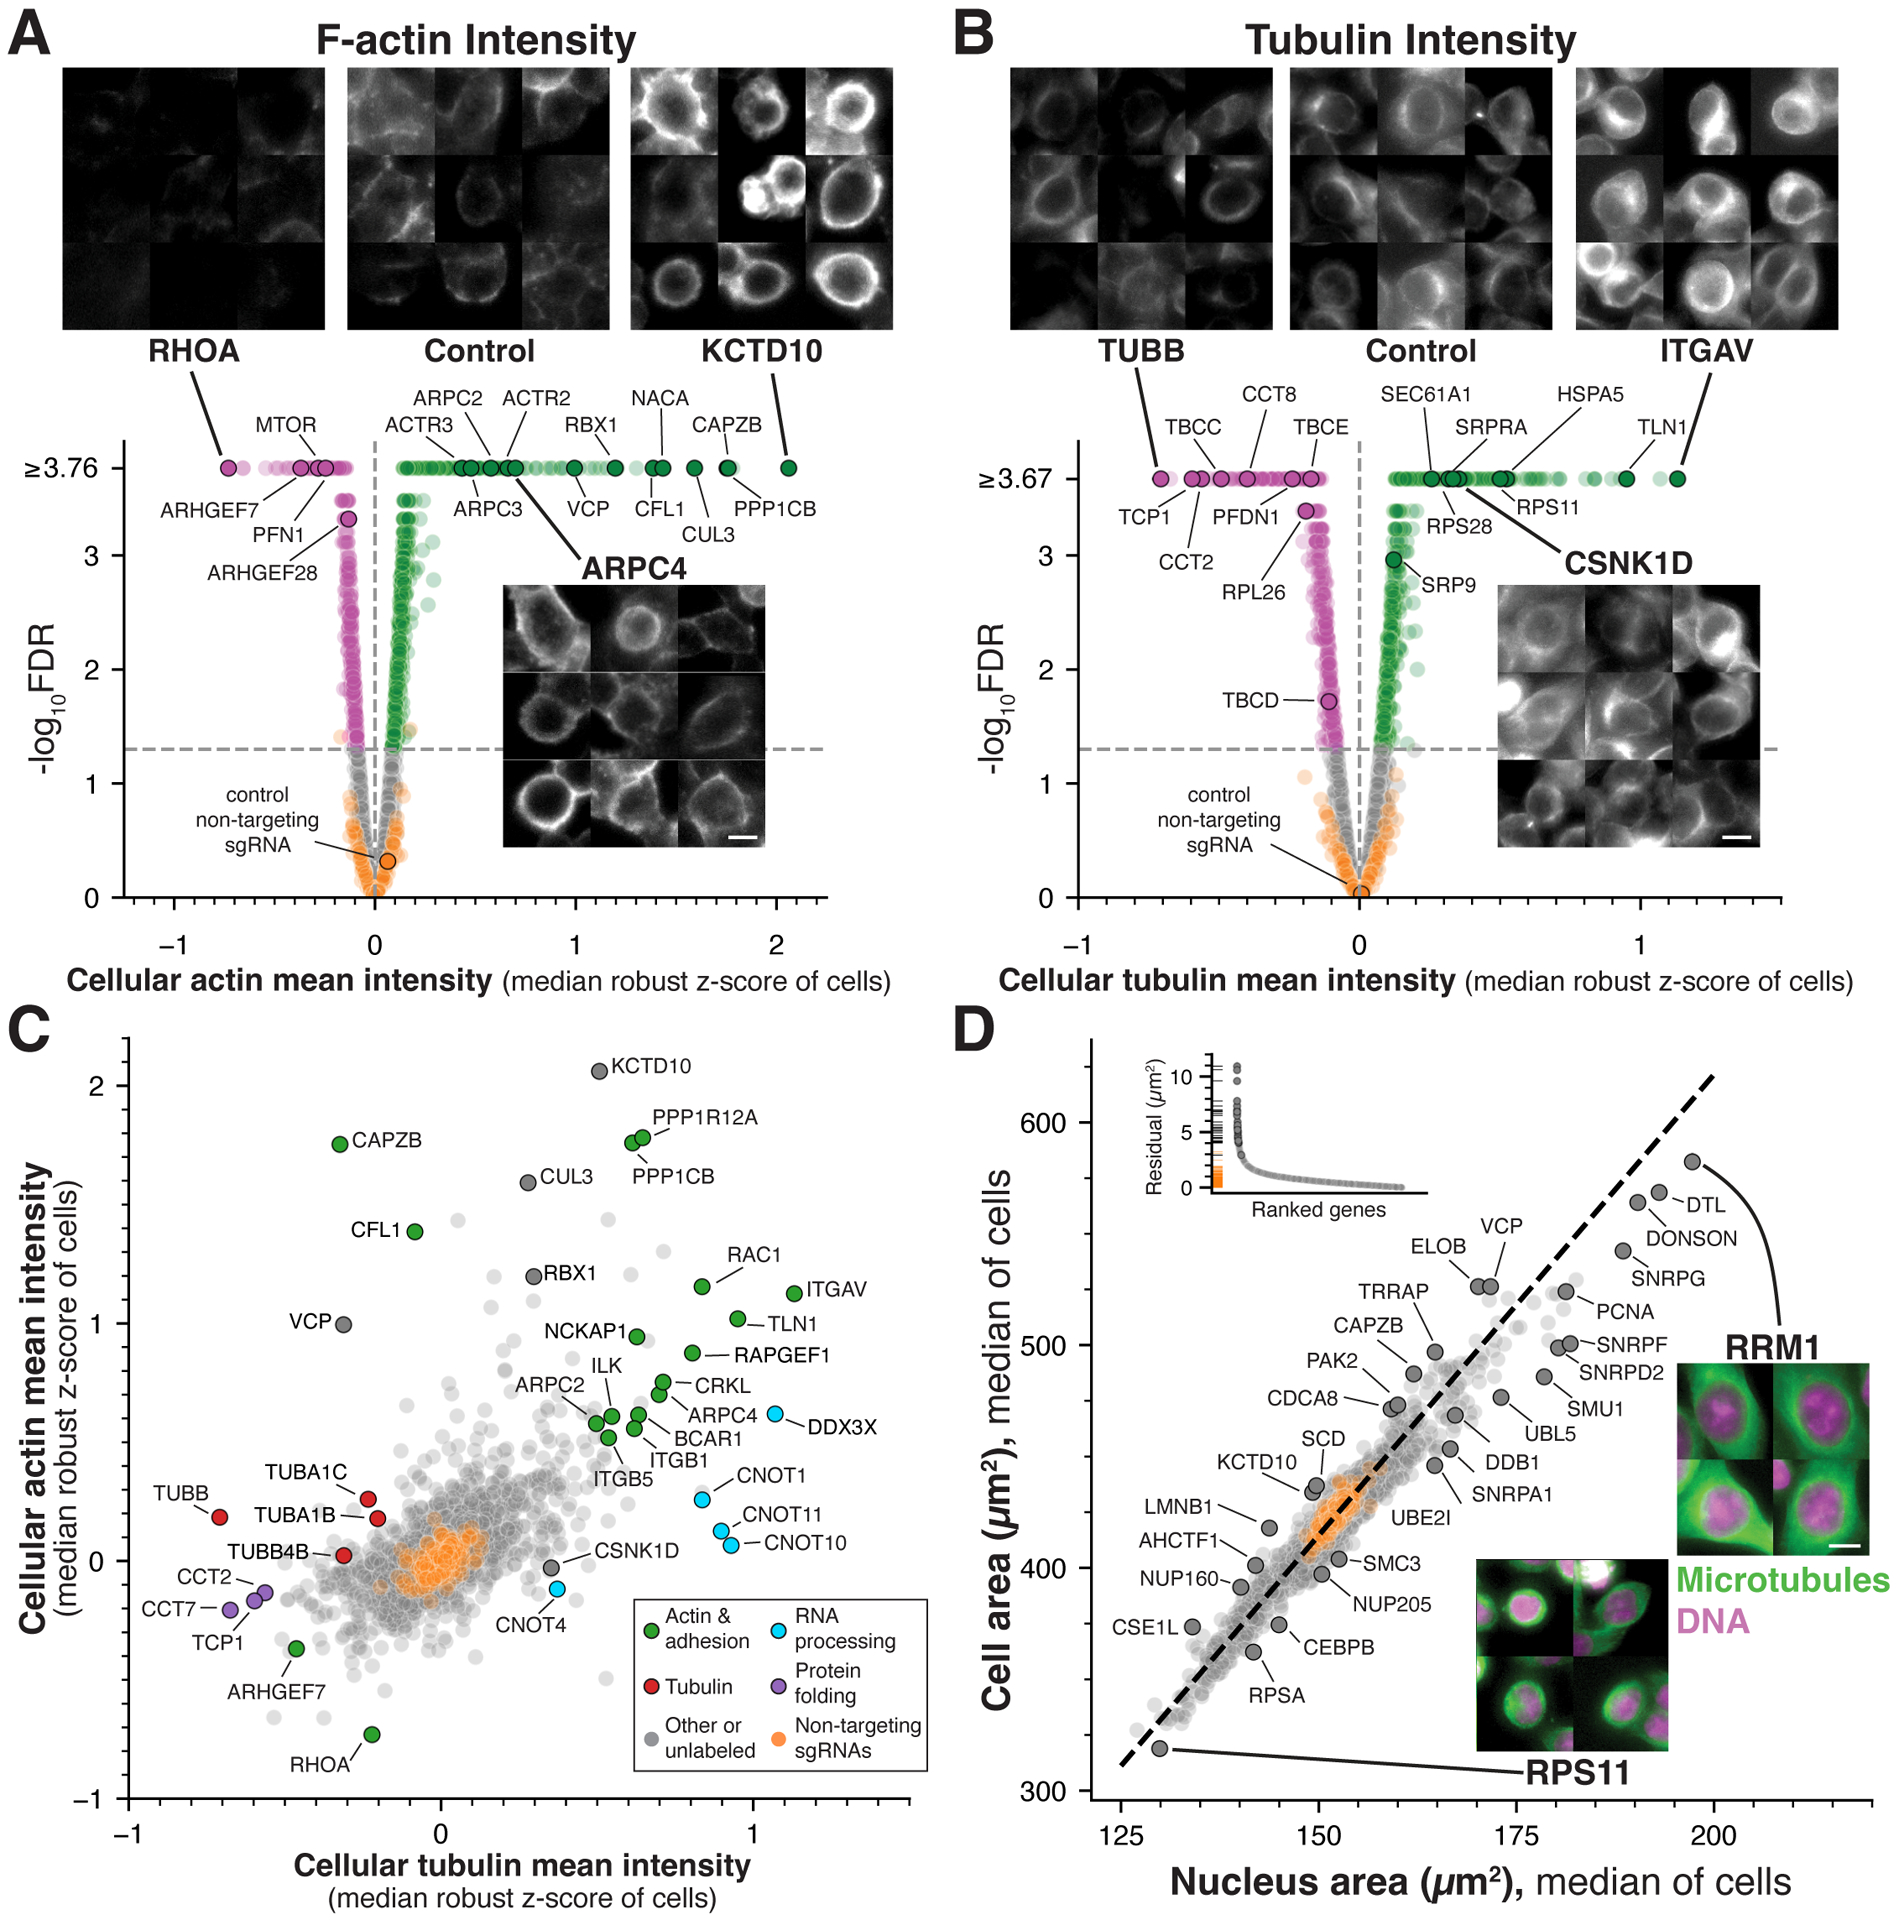
Figure 2. Identification of essential genes regulating cytoskeletal structures and cellular organization.

(A) Selected images and volcano plot for mean cellular F-actin (phalloidin) intensity highlighting gene targets that result in increased (green) or decreased (magenta) actin levels relative to non-targeting control cells (orange; FDR<0.05; STAR Methods). (B) Selected images and volcano plot as in (A) for mean cellular tubulin intensity. (C) Scatter plot comparing the relationship between actin and tubulin intensity highlighting targets that selectively affect one cytoskeletal element (see also Figures S3B–D). Labeled genes are colored by functional category. (D) Scatter plot comparing median cellular and nuclear area across gene targets. These morphological features are highly correlated across conditions (r = 0.96). Orthogonal regression was performed to identify targets resulting in an altered nuclear:cytoplasmic area ratio (dotted line). Labeled genes are also highlighted in the distribution of regression residuals (inset). Example images display DNA (magenta) and tubulin (green) staining for gene targets that result in altered cell and nuclear size. Scale bars, 10 μm.
