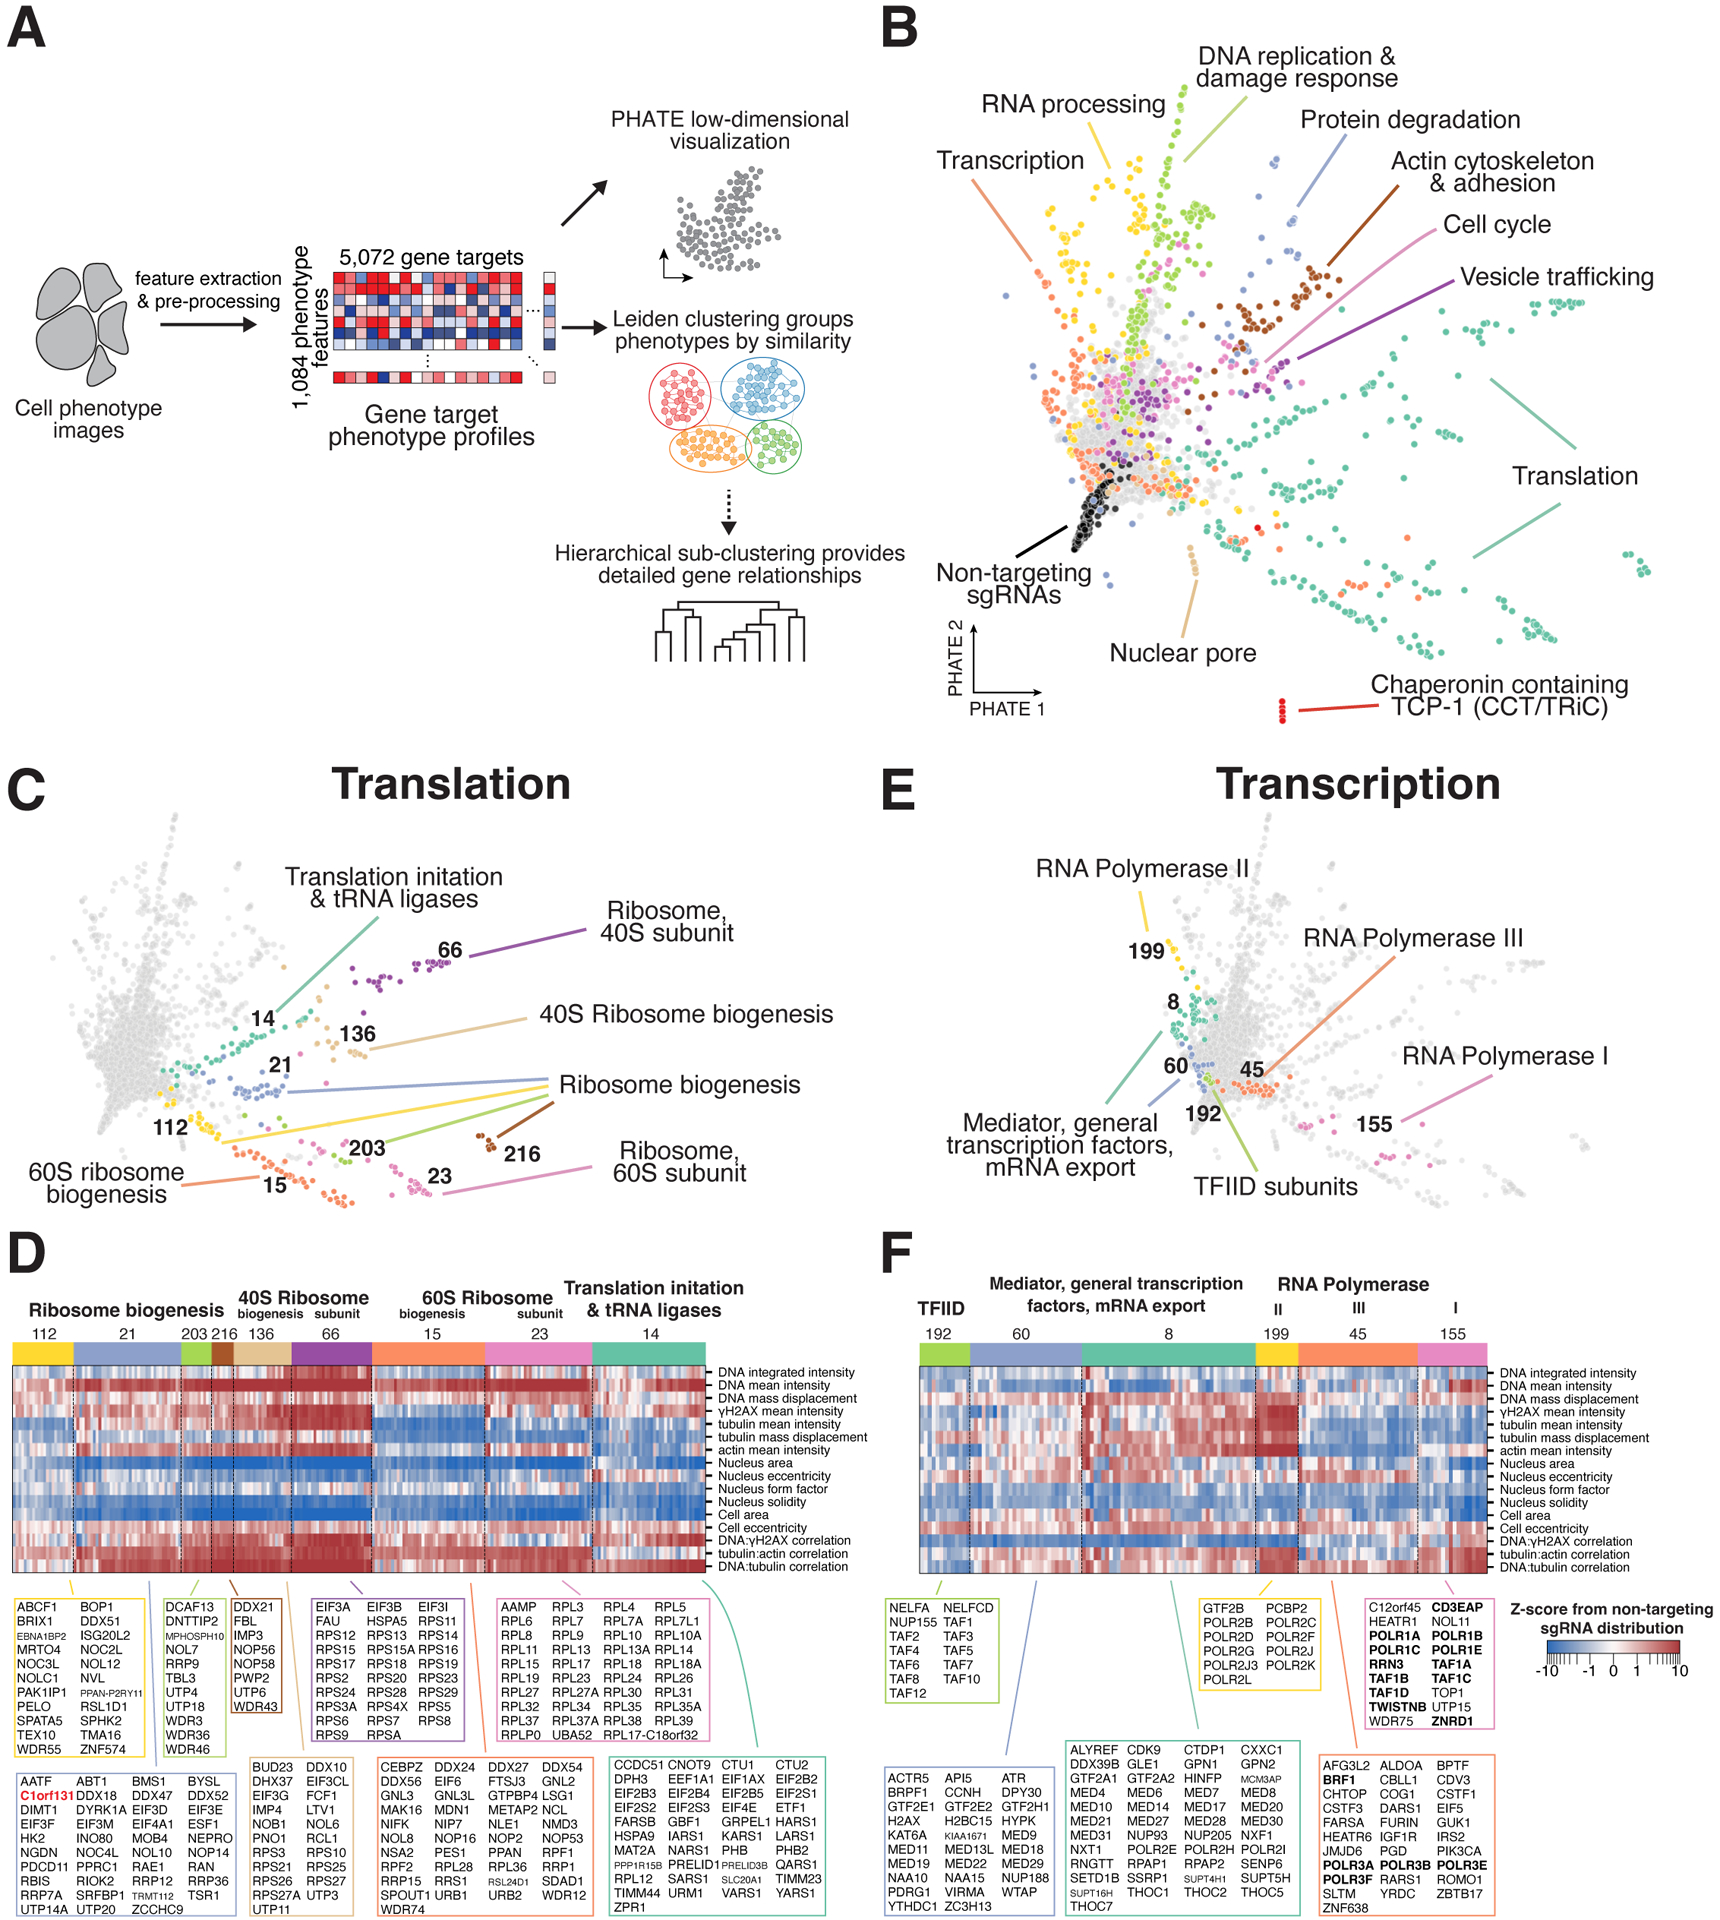
Figure 3. Clustering of multi-dimensional interphase phenotypes reveals co-functional essential genes.

(A) Analysis workflow overview. 1,084 phenotype parameters were extracted from raw cell images and aggregated into profiles for each of the 5,072 genes. The relationships between profiles were visualized using PHATE43 and grouped by similarity using the Leiden clustering algorithm.44 In select cases, hierarchical sub-clustering was performed to identify gene-level phenotype similarities (STAR Methods). (B) Two-dimensional PHATE representation of the interphase phenotype gene profiles from the primary screen. Colors correspond to manually-annotated Leiden clusters containing the labeled functional gene categories. (C) Individual clusters related to translation from (B) identify fine-grained functional sub-categories of genes. Functional descriptions are based on manual annotations. (D) Heat map of interphase knockout phenotypes corresponding to the translation clusters in (C) for a manually-selected subset of phenotype parameters (STAR Methods). All genes from each cluster are listed. (E) Individual clusters of genes related to transcription from (B). (F) Heat map as in (D) corresponding to the clusters in (E) highlighting the phenotypic similarities that define each cluster of genes with transcriptional functions.
