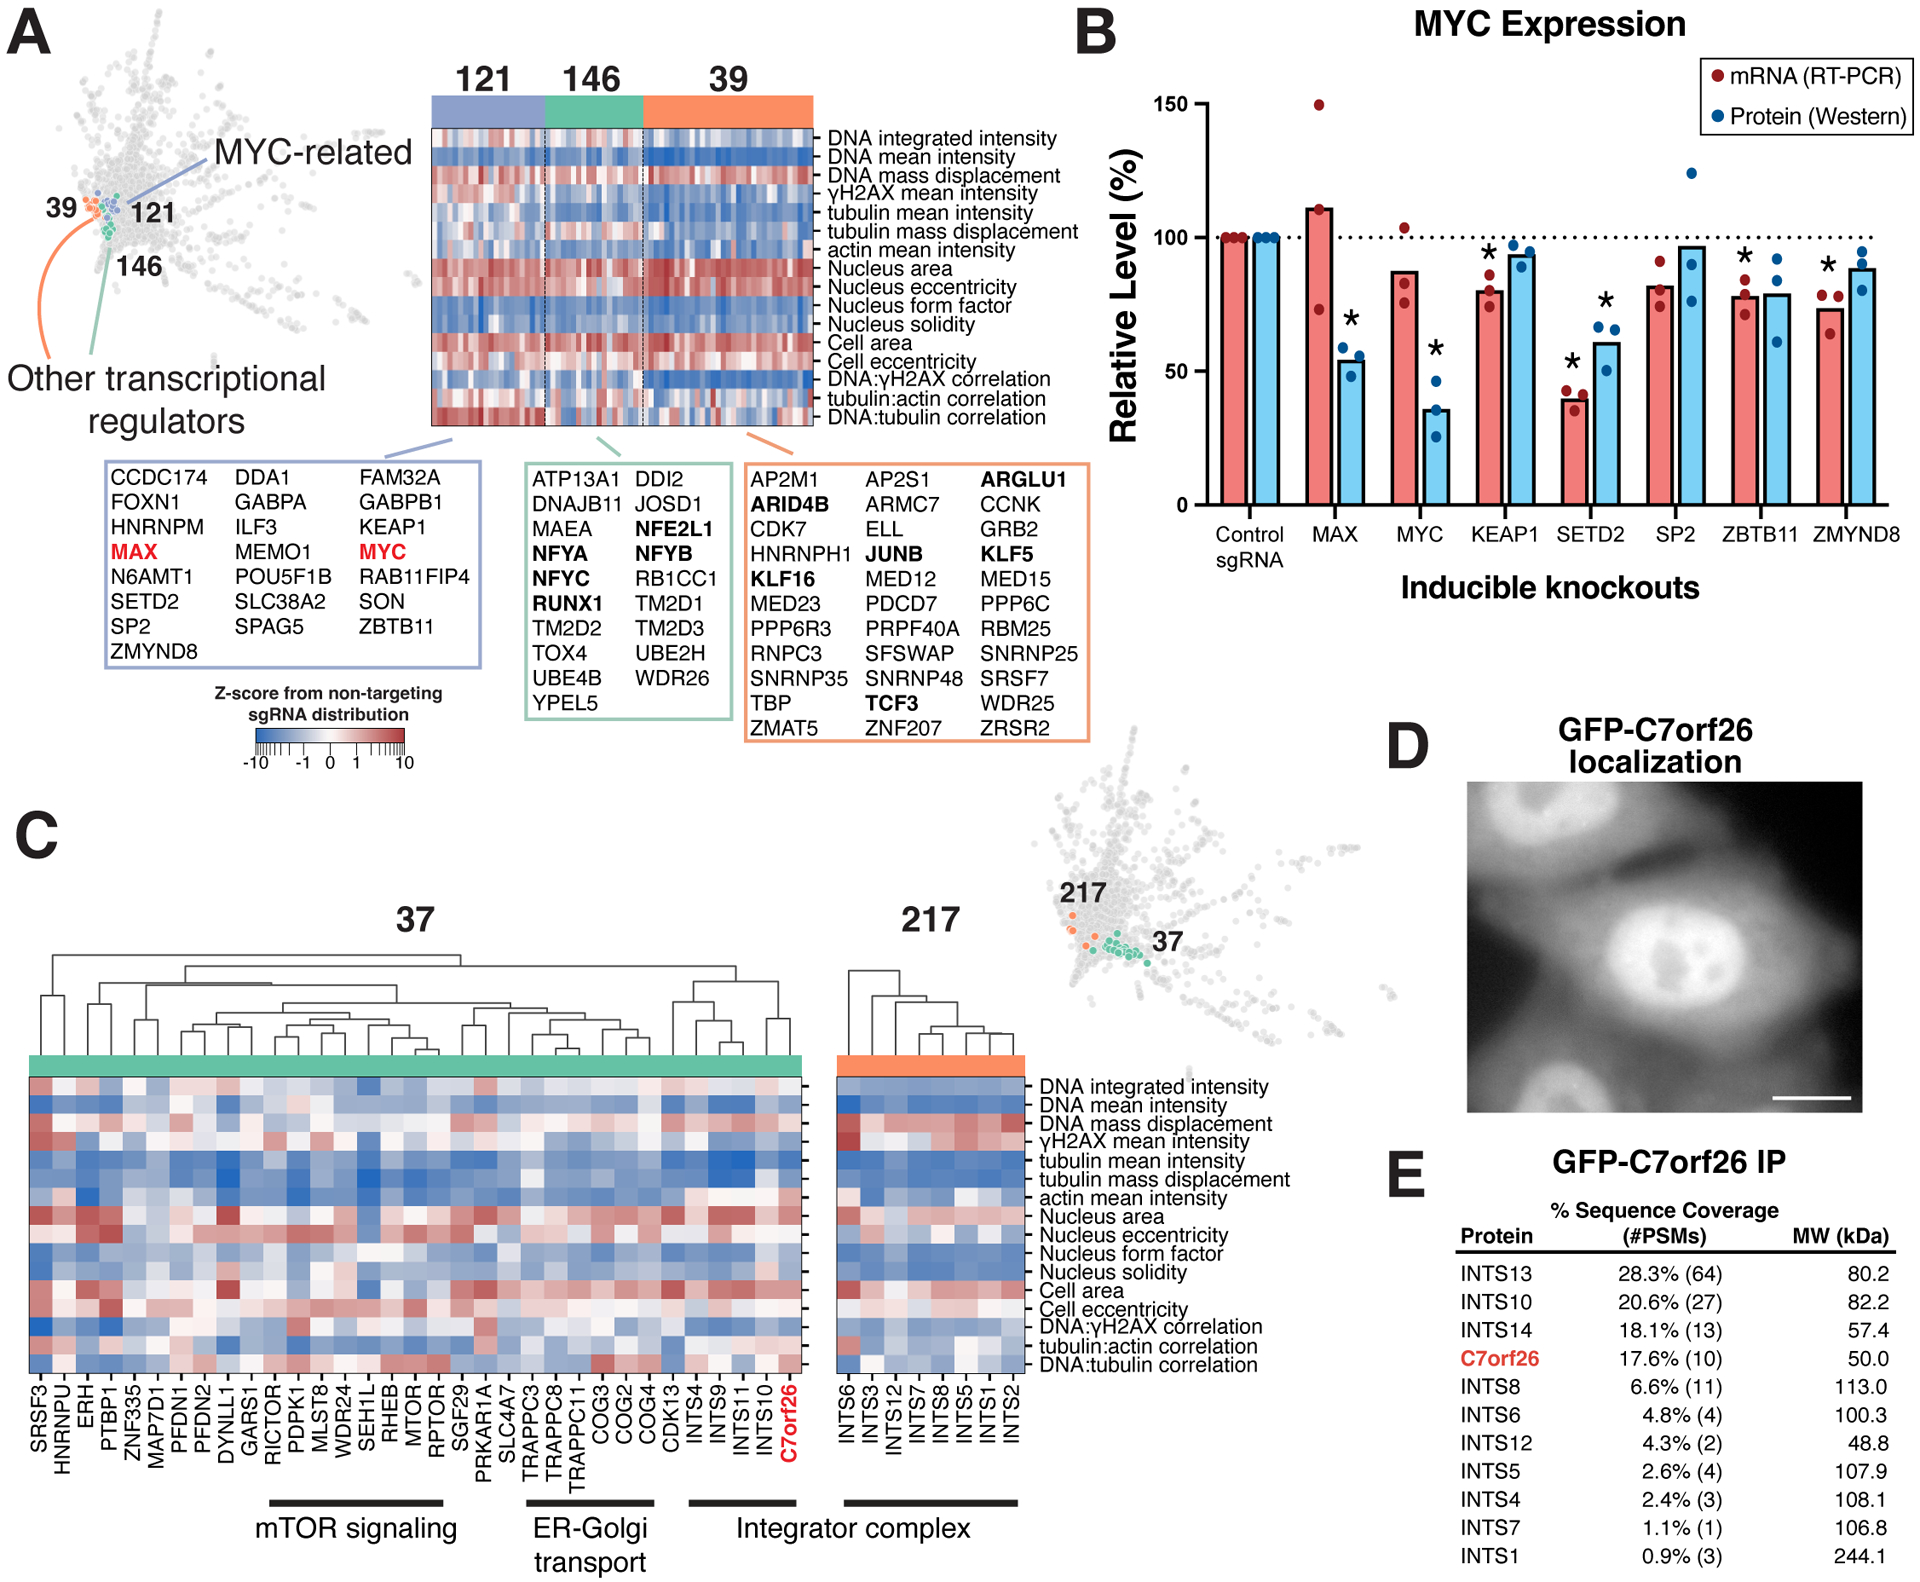
Figure 4. Phenotypic clustering relationships predict gene function.

(A) Heat map of interphase phenotypes for clusters containing transcriptional regulators (STAR Methods). (B) Western blot (see Figure S5G) and mRNA quantification of MYC mRNA and protein expression following knockout of selected genes from cluster 121. *P<0.05 by two-tailed independent T-test relative to corresponding controls. (C) Phenotype heat maps of interphase clusters 37 and 217 as in (A), demonstrating the phenotypic similarity between C7orf26 knockouts with those of Integrator complex subunits. Hierarchical clustering (top) within cluster 37 using the Pearson correlation of PCA-projected phenotype profiles (STAR Methods). (D) GFP-C7orf26 localizes to the nucleus consistent with Integrator complex function. Scale bar, 10 μm. (E) Mass spectrometry from an immunoprecipitation of GFP-C7orf26 from human cells relative to controls.
