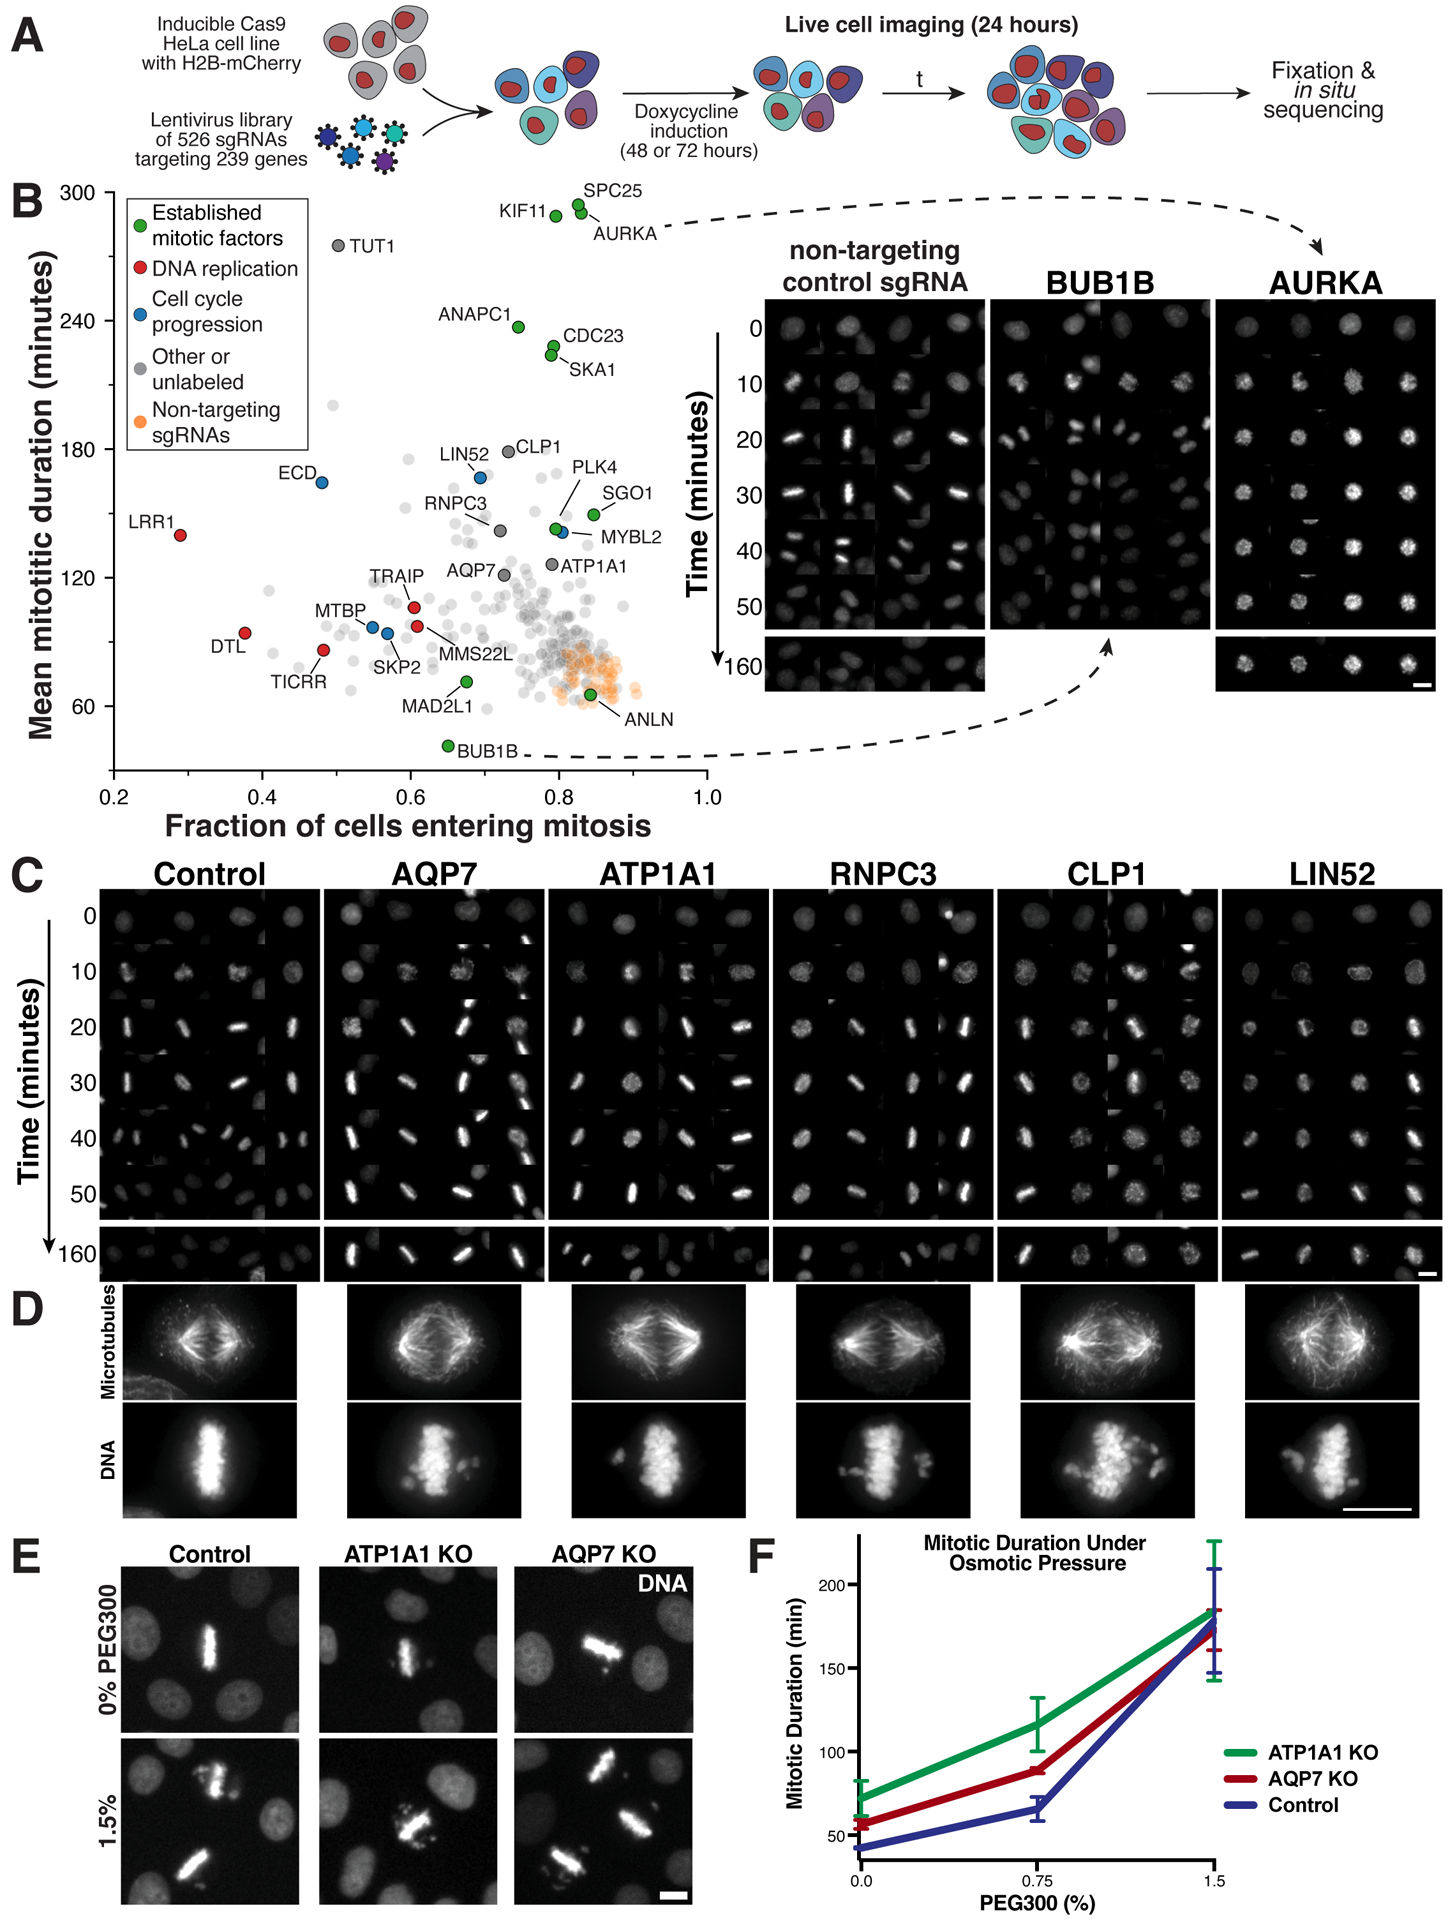
Figure 6. A pooled live-cell screen identifies gene targets required for mitotic progression.

(A) Experimental workflow for the live-cell, image-based pooled CRISPR screen using a cell line expressing an H2B-mCherry fusion (STAR Methods). (B) Left, scatter plot comparing the fraction of cells that enter mitosis within the 24 hour time course and the mitotic duration of observed cell division events. Plotted values represent the mean of sgRNAs targeting the same gene. Right, example images of H2B-mCherry fluorescence at the indicated time points after mitotic entry for knockouts of established cell division components. (C) Example time course montages as in (B) demonstrating mitotic delay and mitotic defects for selected target genes. (D) Immunofluorescence images showing individual cell lines stably expressing a single sgRNA targeting the indicated genes (see also Figure S7A). Images are deconvolved maximum intensity projections of fixed cells stained for microtubules (anti-alpha-tubulin) and DNA (Hoechst). Scale bars, 10 μm. (E) Example images and (F) mitotic duration from time-lapse imaging of control, AQP7, and ATP1A1 inducible knockout cells incubated with varying PEG300 concentrations to induce hyperosmotic stress. n>50 cells per datapoint. Error bars indicate SD.
