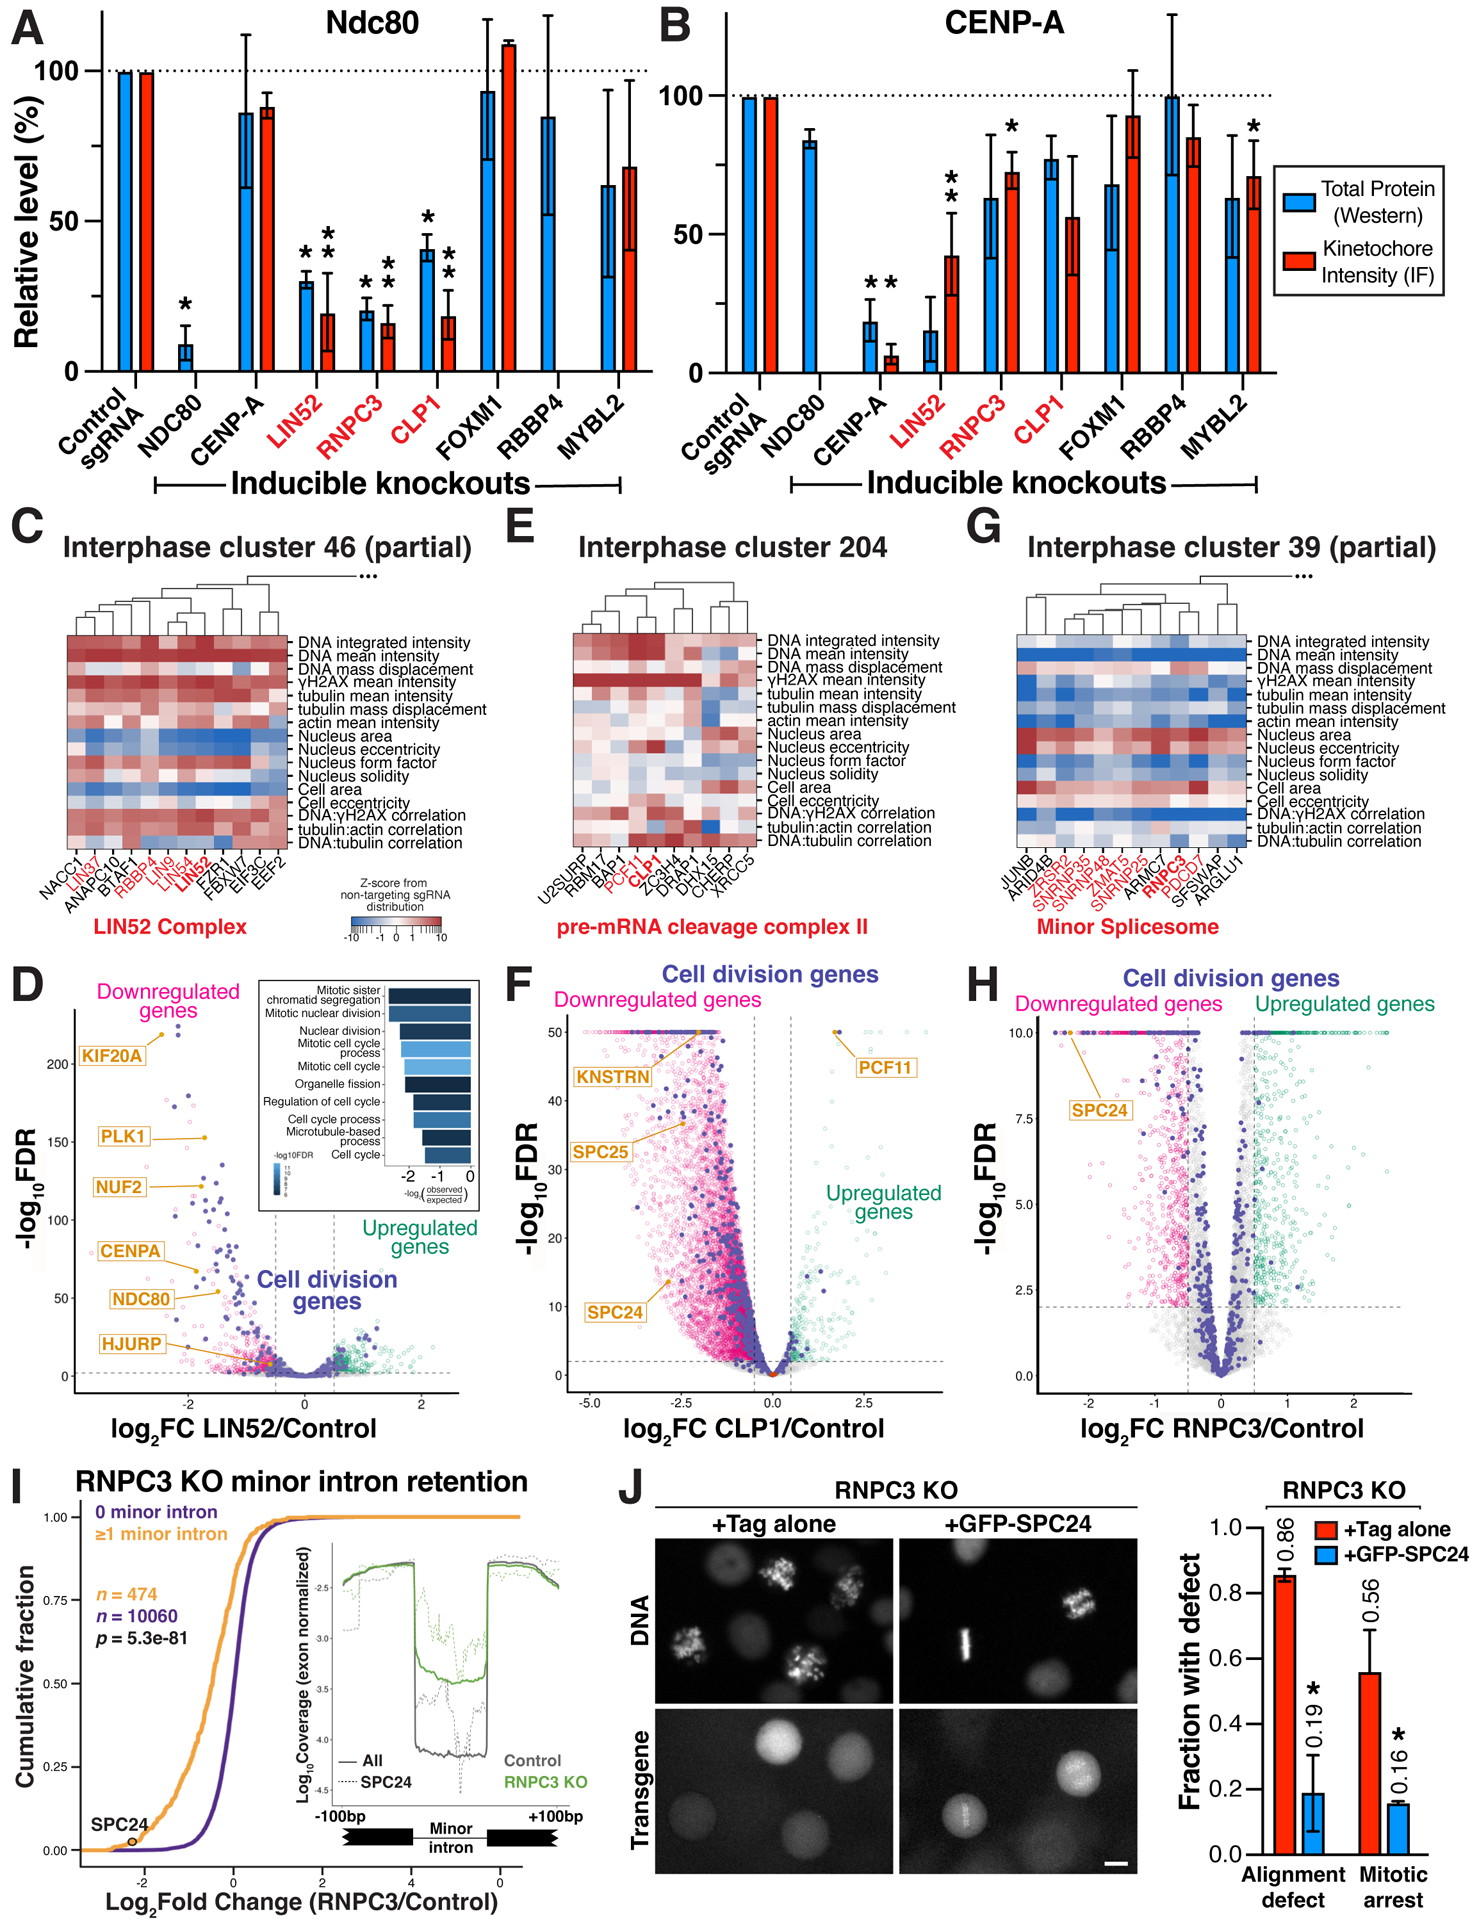
Figure 7. Lin52, Clp1 and RNPC3 functions to promote proper kinetochore assembly and chromosome segregation.

(A) Bar plot showing total protein levels (blue) and kinetochore-localized intensity (red) of the outer kinetochore microtubule-binding protein NDC80 in the indicated inducible knockout cell lines relative to a control sgRNA. N=2 biological replicates for total protein levels, which were normalized to GAPDH. N=2–10 biological replicates for kinetochore measurements, each replicate represents the median kinetochore signal from >10 cells. Both measurements were further normalized relative to controls from the same experiment. *P<0.05, **P<0.01 by two-tailed independent T-test relative to corresponding control samples. ND, no data. Error bars indicate SD. (B) Bar plot as in (A) showing total protein level (blue) and kinetochore-localized intensity for the inner kinetochore centromere-specific histone CENP-A in the indicated inducible knockout cell lines relative to a control sgRNA. Experimental design and statistical tests as in (A). (C) Phenotype heat map and hierarchical clustering for a subset of primary screen interphase cluster 46 genes (STAR Methods). (D) Volcano plot of LIN52 knockout differential expression based on RNA-seq. Genes involved in cell division processes are indicated in purple. Significance threshold FDR < 0.01, log2 effect size > 0.5 for up- (green) and down-regulated genes (magenta). Inset, GO term analysis of LIN52 downregulated genes shows a significant enrichment of mitotic genes. (E) Heat map of primary screen interphase cluster 204 phenotypes as in (C), demonstrating an association of knockout phenotypes for the pre-mRNA cleavage complex II factors CLP1 and PCF11, and the transcriptional termination factor ZC3H4. (F) Volcano plot of differential expression as in (D) following CLP1 knockout, identifying a global decrease in mRNA abundance in these cells including for SPC24 and SPC25, identified by normalizing to library spike-in control RNA (brown). (G) Heat map of a subset of primary screen interphase cluster 39 phenotypes as in (C), demonstrating tight clustering of minor spliceosome components including RNPC3. (H) Volcano plot of differential gene expression as in (D) after RNPC3 knockout, with the SPC24 outer kinetochore component significantly downregulated. (I) Cumulative distributions of mRNA fold change from RNPC3 knockout cells for transcripts containing at least 1 minor intron (orange) are significantly downregulated compared to transcripts with no minor introns (purple). Statistical significance between cumulative distributions was assessed using the Mann-Whitney U test. Inset, minor introns are retained in RNPC3 knockout cells (green), including the minor introns in SPC24 (dotted lines). (J) Left, representative images of H2B-mCherry (DNA) and transgene localization for live RNPC3 knockout cells expressing Tag only or GFP-SPC24. Right, bar plot showing fraction of mitotic RNPC3 knockout cells displaying chromosome alignment defects (n>100 cells) or arrest in mitosis (>2 hours in mitosis; n>45 cells) when expressing Tag only or GFP-SPC24. Error bars indicate SD.
