Figure 1.

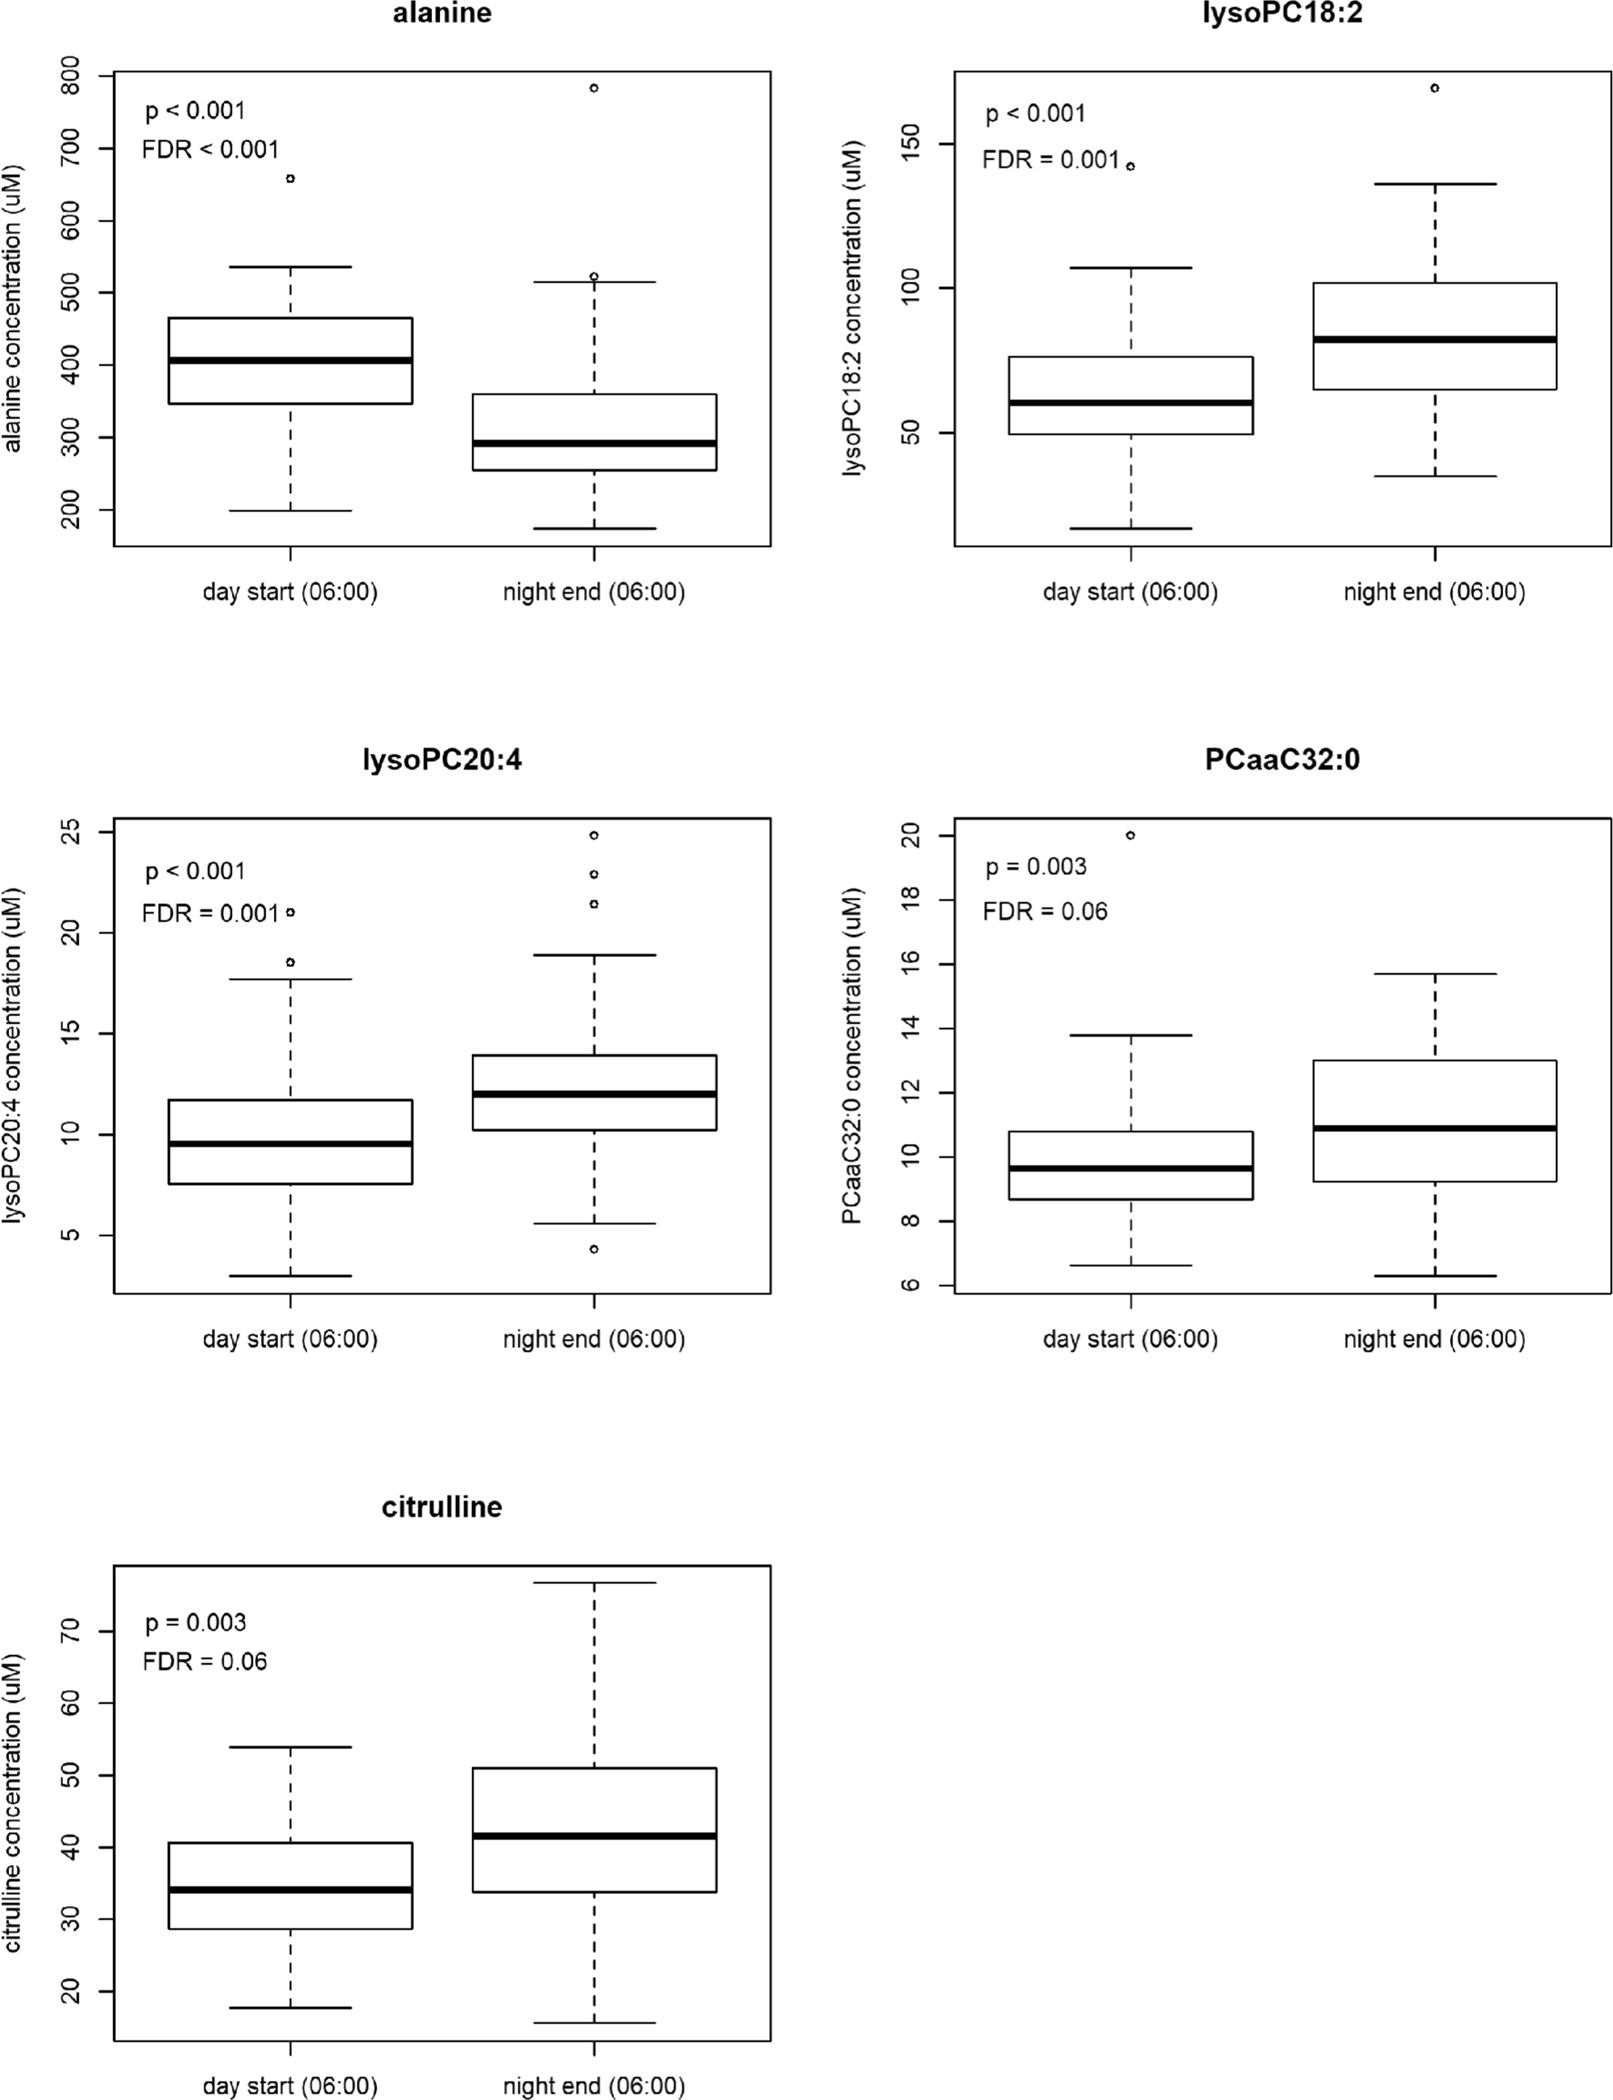
Boxplots showing raw metabolite concentrations (μM) at the start of the day shift and end of the night shift sampling time points that coincide in clock time (06:00 h) for the top 5 metabolite differences using t tests.

Boxplots showing raw metabolite concentrations (μM) at the start of the day shift and end of the night shift sampling time points that coincide in clock time (06:00 h) for the top 5 metabolite differences using t tests.