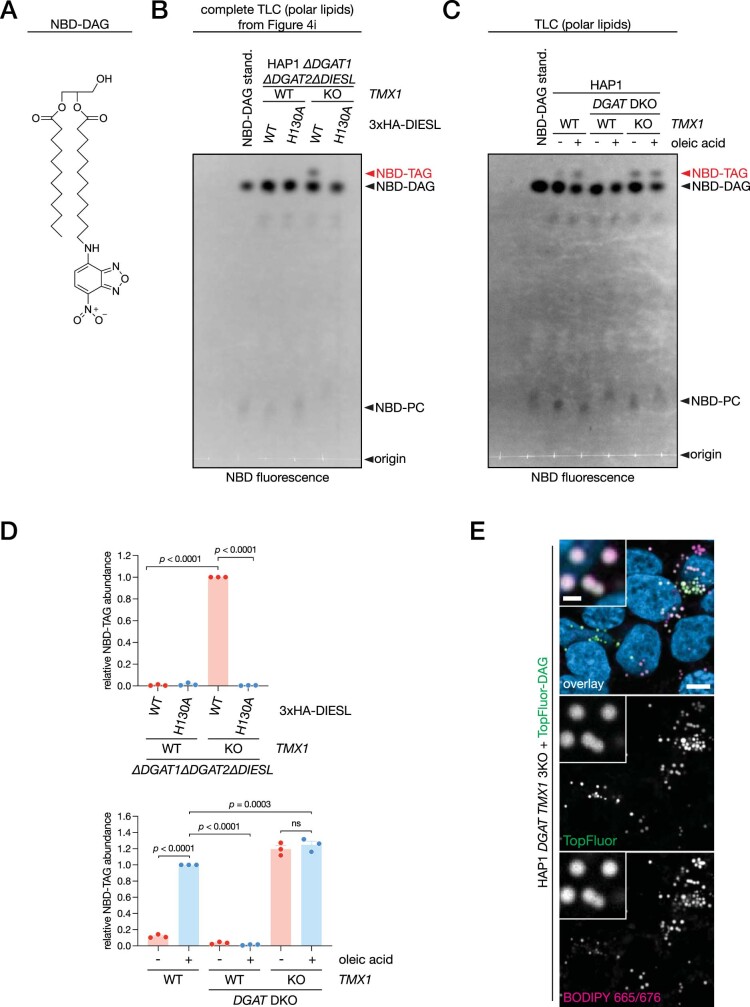
Extended Data Fig. 6. NBD-DAG acylation by DIESL in HAP1 cells.
a, Chemical structure of NBD-DAG. b, Complete TLC plate from Fig. 4i. c, Analysis of NBD-DAG acylation (by NBD fluorescence) by TLC separation of polar lipids. HAP1 WT, DGAT DKO and DGAT DIESL 3KO cells were incubated with 25 µM NBD-DAG in the presence or absence of 50 µM oleic acid for one hour prior to lipid extraction. d, Quantification of NBD-TAG in TLCs from b (top) and c (bottom). Bars represent mean ± SEM of n = 3 independent samples (two-way ANOVA, Bonferroni correction; ns, not significant). e, Confocal imaging of HAP1 DGAT TMX1 3KO labeled with 50 µM TopFluor-DAG. After fixation, membranes were extracted with 0.1% TX-100 and lipid droplets were subsequently stained with BODIPY 665/676. Hoechst 33342, blue; scale bar, 5 and 1 microns.

