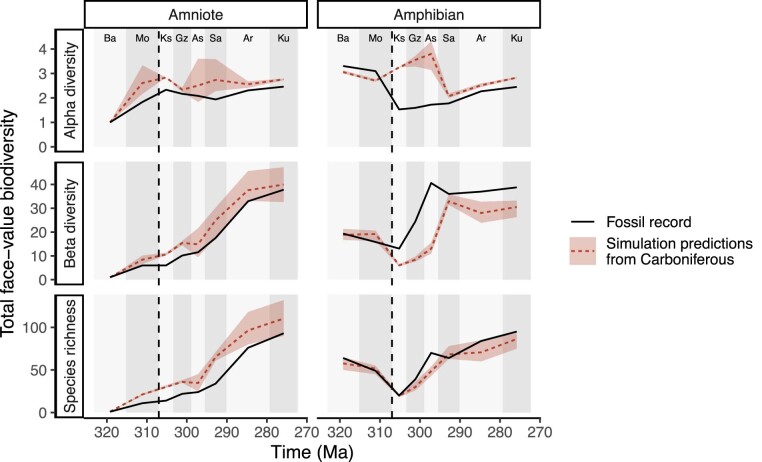
Extended Data Fig. 3. Predictions of diversity from neutral model parameterised on Carboniferous diversity only.
Simulated tetrapod diversity patterns over time compared against the fossil record (that is face-value, unstandardized counts of species). Predictions of tetrapod diversity from a neutral model parameterised solely on Carboniferous diversity. Three metrics of biodiversity (alpha, beta, and gamma diversity; Table 1) are shown for both amphibians and amniotes from the Bashkirian to Kungurian from empirical data (solid black lines) and from simulated communities (dashed lines). The shaded areas surrounding the dashed lines represent the variation in the five best fitting simulations. The dashed vertical line at 307 Ma indicates the timing of the CRC. For definitions of diversity measures see Table 1. Interval abbreviations are as in Extended Data Fig. 1.

