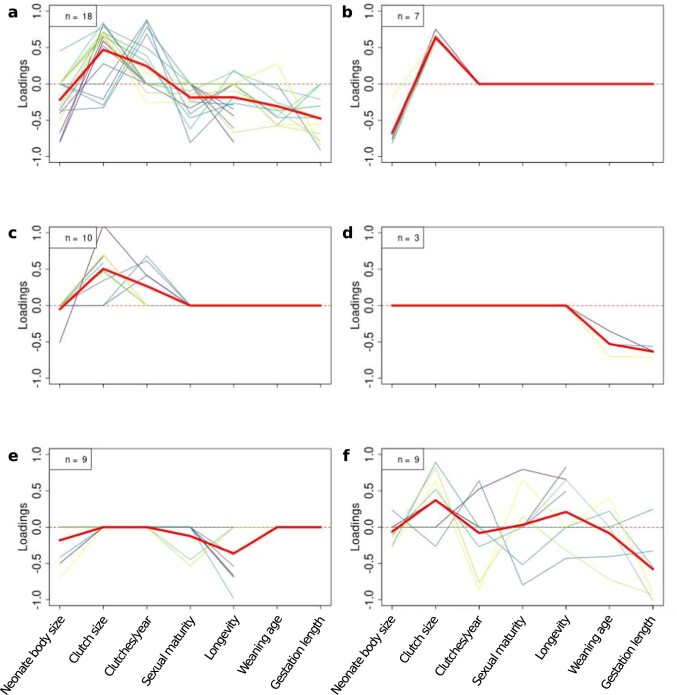
Extended Data Fig. 1. Summary of variable loadings on the second factor of phylogenetic factor analyses, grouped by interpretation of main life history trade-offs.
One thin line corresponds to one clade; the thick red line is the average of all clades in a panel. a) Clades in which we found a clear fast-slow life history spectrum (where fast species reproduced quickly and were short-lived and slow species had opposing traits; 18/56 clades=32%). b), c), d) Clades in which other fast-slow consistent trade-offs structured life history (20 clades=36%). e) Clades in which only one trait loaded onto the second factor (9 clades=16%). f) Clades in which trait covariation did not suggest any trade-off between survival and reproduction consistent with the fast-slow life history spectrum (9 clades=16%).

