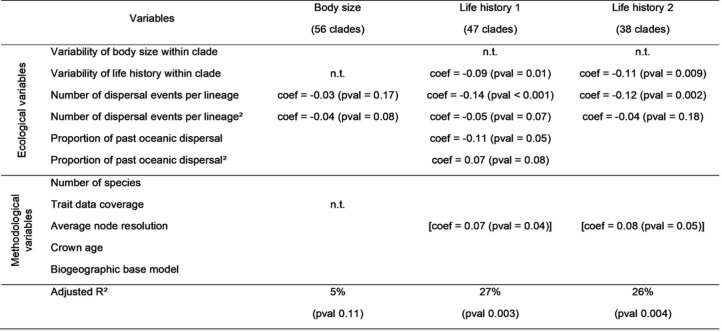
Extended Data Table 1.
Model selection results for the magnitude of trait effects
We conducted multiple linear regressions to explain the effect of several variables (in rows) on the differences between clades in the maximal differences in dispersal rates between trait states (in columns). Due to the large number of variables compared to observations, we took a two-step approach: first, we included only methodological variables in the regressions, then we included ecological variables and those methodological variables that were selected in the first step (no adjustments for multiple comparisons were made). For variables that were selected in the stepwise model selection process we give coefficients and p-values of variables. Variables in square brackets were selected in the regression with only methodological variables, but not in the final regression. Variables that were not tested for a given dataset because we did not hypothesize them to causally influence the magnitude of trait effects are indicated by n.t. Life history 1 is the dataset presented in the main manuscript, including 47 clades in which we identified a fast-slow life history continuum (Extended Data Fig. 2); in Life history 2 we excluded clades where only one variable loaded onto the second factor of the phylogenetic factor analysis.

