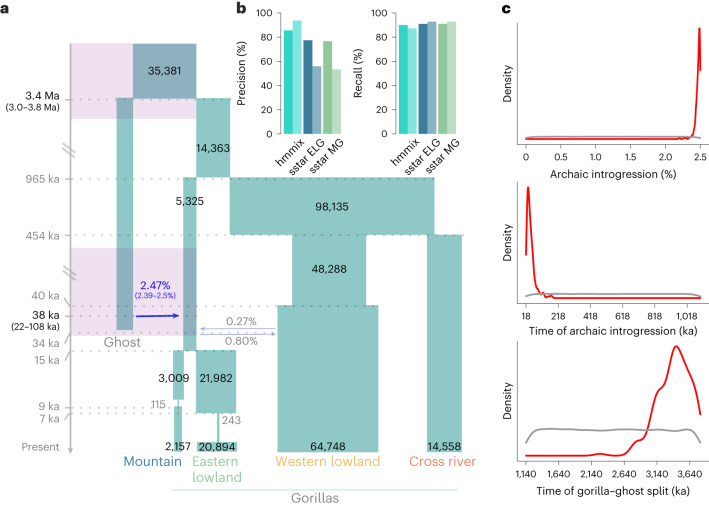
Fig. 2. ABC-based demographic model.
a, Model of gorilla population history with archaic admixture from an unsampled ‘ghost’ lineage into the common ancestor of eastern gorillas. The 95% CrI are shown for the archaic introgression proportion, timing of archaic introgression and archaic divergence (purple timeframes), inferred under ABC modelling. Numbers on blocks represent effective population sizes. b, Precision and recall of hmmix (at the 95% posterior probability cutoff) and S* (at the 99% quantile using sstar31) in simulated data using msprime. Precision (percentage of recovered introgressed fragments) and recall (percentage of true among inferred introgressed fragments) for hmmix and S* (for ELG, eastern lowland gorilla and MG, mountain gorilla). Dark bars represent performance using the model presented in a, light bars represent the ‘worst’ model with large Ne, in the case of hmmix to simulate the data to detect fragments, in the case of S* to obtain the expected distribution of S* scores. c, Posterior distributions for the archaic introgression proportion, time of archaic introgression and gorilla–ghost split time. The grey line indicates the prior distribution. The red line represents the posterior inferred with neural networks. Neural networks reduce the dimensionality of the summary statistics used and account for possible mismatch between the observed and simulated summary statistics54.

