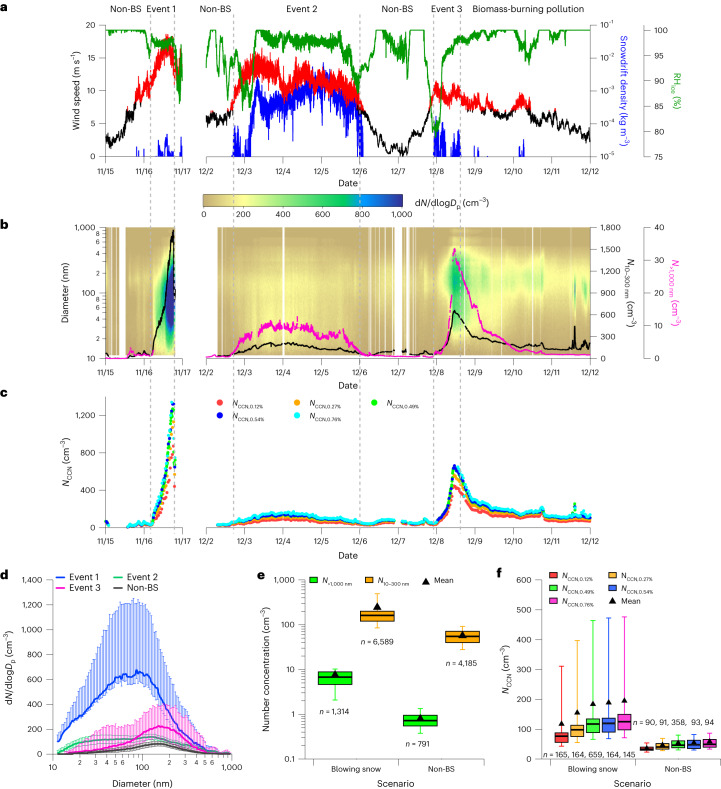
Fig. 1. Meteorological parameters, particle size distribution and NCCN.
a, Time series of snowdrift density at 10 m (November) and 0.1 m (December) in blue, relative humidity with respect to ice (RHice) at 10 m in green and wind speed at 10 m in red (values above the threshold for blowing snow) and black (below the threshold). b, Contour plot of particle number size distribution (dN/dlogDp; here Dp represents the particle diameter) from 10 to 1,000 nm, with time series of fine-mode particle number concentration (N10–300nm) in black and super-micron particle number concentration (N>1,000nm) in magenta. c, Time series of NCCN at different supersaturations. The gray dashed lines indicate the time periods of different scenarios. d, Particle number size distribution during blowing-snow events and adjacent non-blowing-snow (non-BS) periods (from 00:00 on 15 to 04:00 on 16 November, 00:00 to 17:00 on 2 December and 00:00 on 6 to 22:00 on 7 December). Lines represent median values and error bars show 25th and 75th percentiles. e,f, Box plot of N>1,000nm, N10–300nm and NCCN at different supersaturations during blowing-snow events and non-BS periods. Centre lines, box limits and whiskers represent median values, 25th to 75th and 10th to 90th percentiles, respectively. Triangles represent mean values. The sample size used to derive the box plot is shown in the text.

