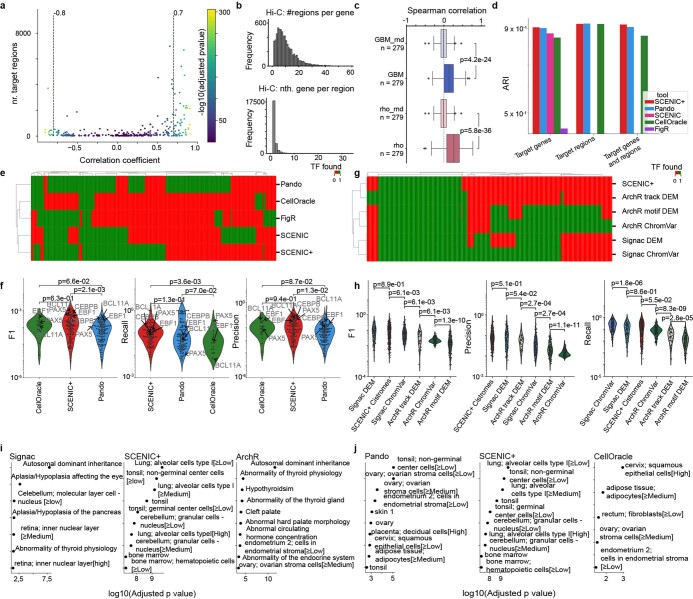
Extended Data Fig. 7. Benchmark of SCENIC+ and other methods on PBMC single-cell multiomics data.
a. Scatter plot showing number of target regions versus TF expression-to-region AUC Pearson correlation coefficients for each eRegulon inferred in the PBMC data set. eRegulons are selected based on a threshold on the correlation coefficient, indicated by dotted line. b. Distribution of the number of regions linked to each gene based on Hi-C in GM12878 (using a minimum score of 1) and the rank, based on absolute distance, for each region and the gene with the highest Hi-C score in GM12878. c. Boxplots showing the distribution of Spearman correlation coefficients between Hi-C scores in GM12878 and region-to-gene importance score and region-to-gene correlation coefficients (rho) as calculated by SCENIC+ for B-cell marker genes. Upper/lower hinge represent upper/lower quartile, whiskers extend from the hinge to the largest/smallest value no further than 1.5 times the interquartile range from the hinge respectively. Median is used as center. Random controls are obtained by shuffling the gradient boost importance scores (GBM_rnd) and correlation coefficients (rho_rnd). Difference in the mean to the random control is assessed using the Mann-Whitney U test. d. Adjusted Rand Index (ARI) quantifying how well cell types are separated based on the AUC scores for the PBMC data set. e. Heat maps showing whether a TF is found across different methods comparing SCENIC+ to Signac and ArchR. Signac and ArchR were run using different options. (1) DEM: Differentially Enriched Motifs or ChIP-seq tracks in differentially accessible regions and (2) ChromVAR deviations. f. Scatter plot showing enrichment of top 10 Human Protein Atlas and Human Phenotype GO terms for TFs found exclusively by Signac, Archr or all methods including SCENIC+. g. Heat maps showing whether a TF is found across different methods. GRaNIE is not included because the analysis ran out of memory (tested on a machine with 72 cores Intel(R) Xeon(R) Platinum 8360Y CPU @ 2.40 GHz and 2 TB of memory). h. Scatter plot showing enrichment of top 10 Human Protein Atlas and Human Phenotype GO terms for TFs found exclusively by Pando, CellOracle or all methods including SCENIC+.

