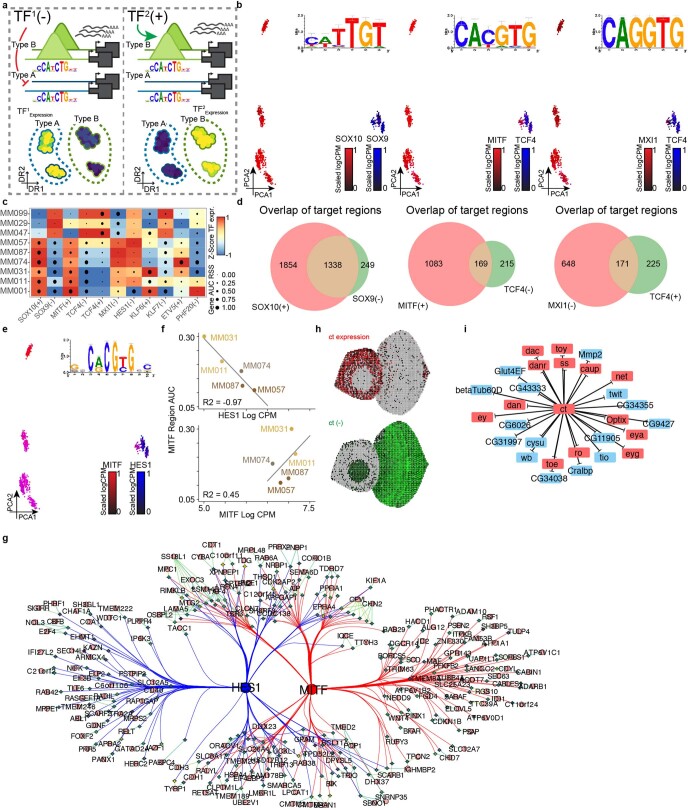
Extended Data Fig. 10. Repressor predicitons of SCENIC+ in melanoma and eye-antennal disc.
a. TFs of the same family for which the expression is anti-correlated in a system can cause spurious repressor predictions. Scenario 1 (left): TF1 is a potential repressor which is expressed in cell type A and actively closes chromatin in that cell type. Scenario 2 (right): TF2 is a potential activator of the same TF family as TF1 which is expressed in cell type B and opens the chromatin in that cell type. Both scenarios lead to the same gene expression and chromatin-accessibility measurements and can thus not be disentangled if both TF1 and TF2 are present in the same system. b. Principal-Component Analysis (PCA) projection of 936 pseudo mutli-ome cells based on cellular enrichment (AUC scores) of predicted target genes and regions from SCENIC+ eRegulons colored by gene expression. Shared motif used by the pair of TFs in each plot is shown on the top right. c. Heat map-dotplot showing TF expression of the eRegulon on a color scale and cell type specificity (RSS) of the eRegulon on a size scale. d. Venn diagram showing overlap of predicted target regions of SOX10 and SOX9, MITF and TCF4; and MXI1 and TCF4. e. Principal-Component Analysis (PCA) projection of 936 pseudomutli-ome cells based on cellular enrichment (AUC scores) of predicted target genes and regions from SCENIC+ eRegulons colored by the expression of MITF and HES1. Shared motif used by the pair of TFs in each plot is shown on the top right. f. Log(CPM) expression of HES1 (top, x axis) and MITF (bottom, x axis) versus MITF target region AUC value (y axis). Line fit using linear regression, least squares method. g. Network showing subset of MITF and HES1 target regions. Diamonds represent regions circles represent genes and are color-coded by the average accessibility LogFC of corresponding regions in the melanocytic state. h. Virtual eye-antennal disc with 5,058 pseudocells colored by Ct expression and AUC values of the repressive Ct regulon. i. Targets of the Ct repressive regulon, showing in red targets that are transcription factors.

