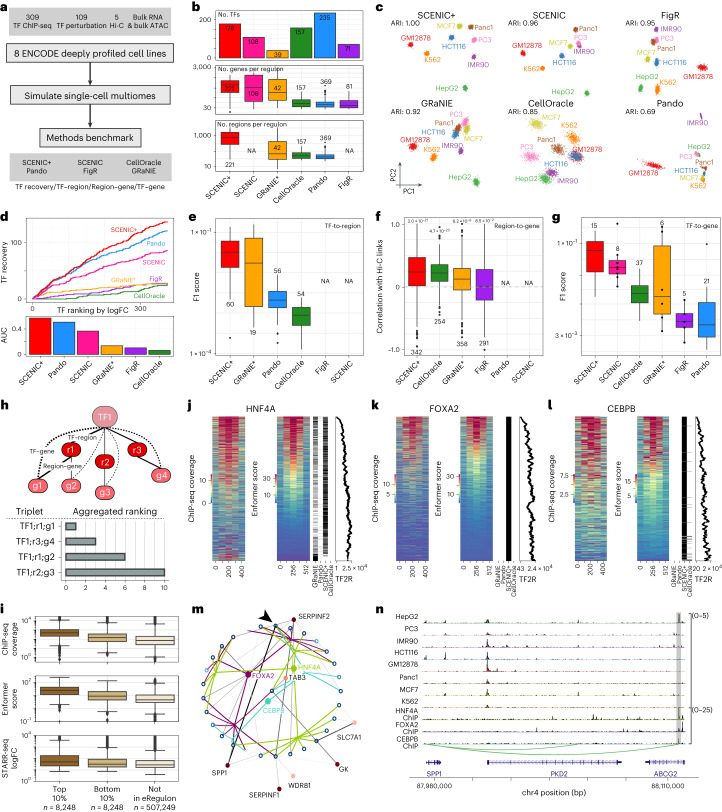
Fig. 3. Benchmark of SCENIC+ and other single-cell multiomics GRN inference methods using ENCODE deeply profiled cell lines.
a, Diagram of benchmarking strategy. b, Number of TFs identified per method and distributions of the number of target genes and regions per regulon and method. c, PCA based on target gene and region enrichments and ARI quantification (4,000 cells). d, Cumulative recovery, per method, of TFs ranked in descending order by maximum logFC based on differential gene expression between all cell lines. e, F1 score distributions from the comparison of regulon target regions, per method and UniBind. f, Correlation between Hi-C links for top 100 marker genes and region–gene scores per method. Two-sided Wilcoxon rank-sum test comparing mean correlation of links versus shuffled links. The Holm method was used to correct for multiple testing. g, F1 score distributions from the comparison of regulon target genes, per method and TF perturbation data. h, Diagram of triplet ranking. i, Distributions of experimental and predicted TF ChIP-seq coverage and STARR-seq logFC target regions and other consensus peaks (not in eRegulon). j–l, Heat maps showing experimental and predicted ChIP-seq coverage on the union of predicted target regions per method with binary heat map indicating regions found per method and scatter-plot showing TF-to-region (TF2R) ranking of SCENIC+ target regions, for the TFs HNF4A (j), FOXA2 (k) and CEBPB (l). m, Network for top ten edges, targeted by any of FOXA2, HNF4A or CEBPB. Open and closed circles represent regions and genes and their color is proportional to the accessibility/gene expression logFC, respectively. Region-to-gene edges width and color represent importance scores. Arrow indicates the highlighted SPP1 enhancer (chr4:88107462–88107963). n, Chromatin-accessibility profiles across cell lines and HNF4A, FOXA2 and CEBPB ChIP-seq coverage on the SPP1 locus, with region-to-gene links and the SPP1 enhancer highlighted. For box-plots in b, e–g and i, the top/lower hinge represents the upper/lower quartile and whiskers extend from the hinge to the largest/smallest value no further than 1.5 × interquartile range from the hinge, respectively. The median is used as the center. NA, data are not available for the method. GRaNIE* was run with simulated single-cell data instead of bulk.

