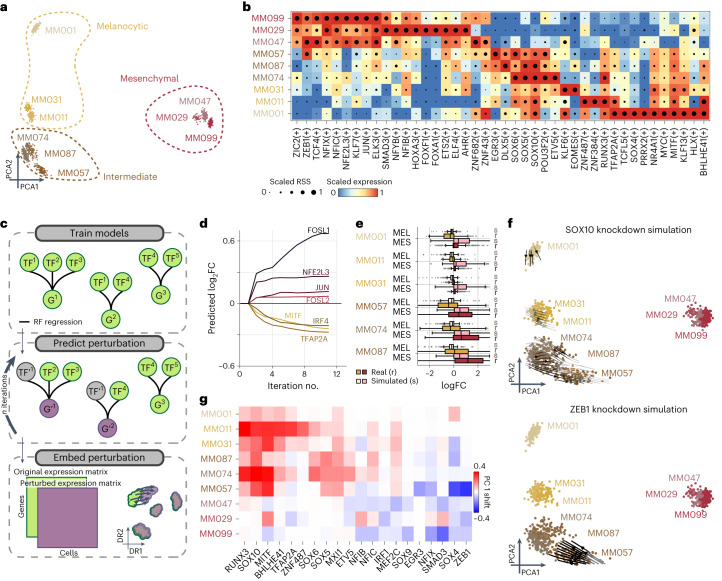
Fig. 4. SCENIC+ analysis using separate scATAC-seq and scRNA-seq data on a mix of human melanoma lines.
a, PCA of 936 pseudo-multiome cells based on target gene and target region enrichment scores. b, Heat map/dot-plot showing TF expression of the eRegulon on a color scale and cell-type specificity (RSS) of the eRegulon on a size scale. c, Illustration of how predictions from SCENIC+ can be used to simulate TF perturbations. Top: SCENIC+ is used as a feature selection method and RF regression models are fitted for each gene using TF expressions as predictors for gene expression. Middle: the expression of TF(s) is altered in silico and the effect on gene expression is predicted using the regression models, which is repeated for several iterations to simulate indirect effects. Bottom: the original and simulated gene expression matrices are co-embedded in the same dimensionality reduction to visualize the predicted effect of the perturbation on cell states. d, Predicted logFC of mesenchymal (red shades) and melanocytic (yellow shades) marker genes over several iterations of SOX10 knockdown simulation. e, Simulated (s) and actual (r) distribution of logFCs of melanocytic (n = 523) and mesenchymal (n = 722) marker genes after SOX10 knockdown across several melanoma lines. Upper/lower hinge represents upper/lower quartile, whiskers extend from the hinge to the largest/smallest value no further than 1.5 × interquartile range from the hinge respectively. The median is used as the center. f, Simulated shift after SOX10 and ZEB1 knockdown represented using arrows. Arrows are shaded based on the distance traveled by each cell after knockdown simulation. g, Heat map representing the shift along the first principal component of each melanoma line after simulated knockdown of several TFs.

