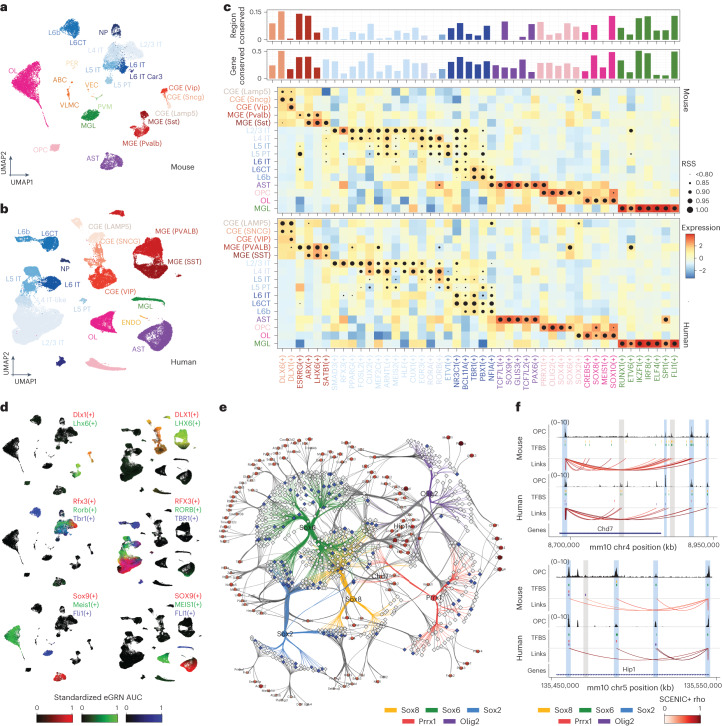
Fig. 5. SCENIC+ reveals regulatory lexicon conservation across mammalian brains.
a, Uniform Manifold Approximation and Projection (UMAP) dimensionality reduction of 19,485 mouse cortex cells based on target gene and region enrichment scores. b, UMAP dimensionality reduction of 84,159 human motor cortex cells based on target gene and region enrichment scores. c, Heat map/dot-plot showing TF expression of the eRegulon on a color scale and cell-type specificity (RSS) of the eRegulon on a size scale. The bar-plot above indicates the percentage of the regulon that is conserved in the other species, for predicted target regions (top) and target genes (bottom). d, Mouse and human UMAPs colored by enrichment scores for selected regulons using RGB encoding. e, Mouse-based OPC eGRNs with conserved TFs. Regions are shown as a diamond shape and their size represents the logFC of the region accessibility in OPCs compared to the rest of the cells. Regions conserved in the human brain are shown in blue and regions only found in the mouse analysis are shown in gray. Genes are shown as a circular shape and their color and size represent the logFC of the gene expression in OPCs compared to the rest of the cells. TF–region links are colored by TF and region–gene links are colored by region–gene correlation coefficients. f, OPC coverage, TFBSs and region–gene links in two loci, Chd7 and Hip1. Data are shown in the mouse genome (mm10) and human data have been lifted over (mm10). Peaks found in both human and mouse are highlighted in blue, whereas peaks only accessible in one of the species are highlighted in gray. ABC/VLMC, vascular leptomeningeal cell; AST, astrocyte; CT, cortico-thalamic; ENDO, endothelial cell; IT, intratelencephalic; MGL, microglia; NP, near-projecting; PER, pericyte; PVM, perivascular macrophage; PT, pyramidal-tract; OL, oligodendrocyte; VEC, vascular endothelial cell.

