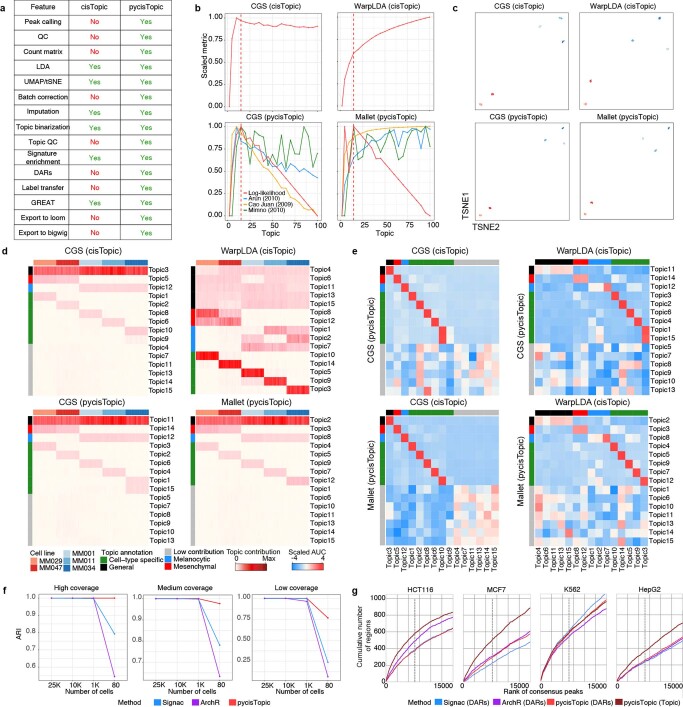
Extended Data Fig. 1. Cell type and enhancer discovery benchmark with pycisTopic, cisTopic, Signac and ArchR.
a. Feature comparison between cisTopic and pycisTopic. b. Model selection for models (for 100 cells simulated from melanoma cells lines) with different parameter optimization methods, namely Collapsed Gibbs Sampler (CGS) and WarpLDA with cisTopic and CGS and Mallet with pycisTopic. cisTopic relies on the log-likelihood per model; while pycisTopic incorporates additional measurements including coherence (Minmo (2010)), a density-based metric (Cao Juan (2009) and a divergence-based metrics (Arun (2010)). c. Cell-topic dimensionality reduction for each of the models (100 cells). Red clusters denote the 2 mesenchymal cell lines, blue clusters depict the 3 melanocytic cell lines. d. Cell-topic enrichment heat map for each of the models. General topics are shown in black; mesenchymal, in red; melanocytic, in blue; cell line specific in green; and low contributing in gray. e. AUCell enrichment of topics between different models. f. Adjusted Rand Index (ARI) for pycisTopic, Signac and ArchR in simulated datasets with different coverage per cell (3 K, 10 K, or 20 K fragments per cell) and number of cells, using as ground truth the bulk label from which cells were simulated. Data was simulated from bulk ATAC-seq and bulk RNA-seq data from ENCODE’s Deeply Profiled Cell Lines. g. Recovery curves for top 5 K Differentially Accessible Regions (DARs) identified by Signac, pycisTopic and ArchR and top 5 K regions in the cell line specific topics identified by pycisTopic. Genome-wide STARR-seq in HCT116, MCF7, K562 and HepG2 is ranked in descending order (x axis) when a region of the ranking is found in a region set an increasing step along the y axis is taken. Dashed line represents the top 10% of the ranking.

