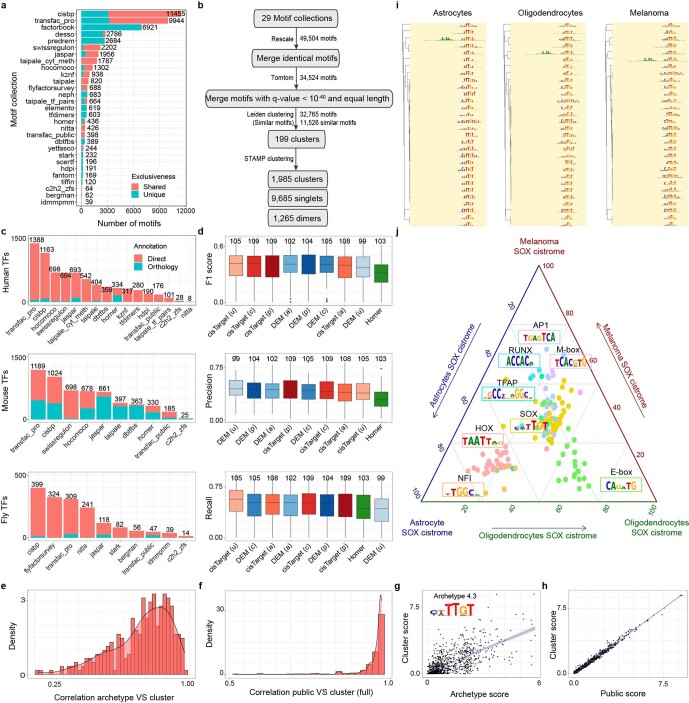
Extended Data Fig. 2. The SCENIC+ motif collection.
a. Number of motifs per motif collection that are shared or unique for one collection. b. Workflow depicting the motif collection cluster strategy. c. Number of motifs annotated directly or by orthology per motif collection. d. F1 score (top), precision (middle) and recall (bottom) distributions of TF cistromes from motif enrichment on 309 TF ChIP-seq data sets from ENCODE, using different databases and motif enrichment methods, namely Homer, pycisTarget and DEM. The unclustered databases (u) include all annotated motifs before clustering (singlets), the archetype databases (a) use the consensus motifs of the clusters based on STAMP and the clustered databases uses the motif clusters (c), scoring regions using all motifs in the cluster and the public databases (p) is the clustered database without licensed Transfac Pro motifs. Upper/lower hinge represent upper/lower quartile, whiskers extend from the hinge to the largest/smallest value no further than 1.5 times the interquartile range from the hinge respectively. Median is used as center. e. Distribution of the correlation between scores (on chr19) using archetypes or all motifs in a cluster. f. Distribution of the correlation between scores (on chr19) using all motifs in a cluster or all motifs except for Transfac Pro motifs. g. Correlation between scores (on chr19) for cluster 4.3 using the archetype or all motifs. h. Correlation between scores (on chr19) for cluster 4.3 using all motifs or all motifs except for Transfac Pro motifs. i. Top 30 motifs identified by cisTarget using regions in the SOX cistromes from melanoma, oligodendrocytes and astrocytes clustered using motifStack. Colors indicate the TF family of the motifs (in this case, SOX). j. Ternary plot showing enrichment scores of motifs found in melanoma, oligodendrocyte and astrocyte SOX regions. Each corner represents a cell-type-specific SOX topic, dots represent enriched motifs and axes represent average enrichment scores for each topic. The colors of the dots are used to indicate the TF family to which the motifs belong.

