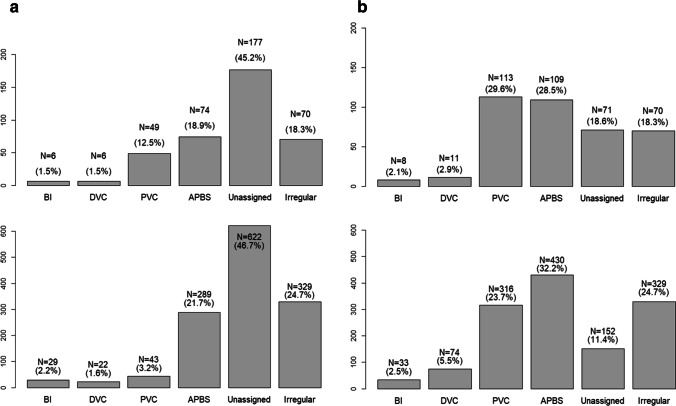
Fig. 4.
a Histogram presenting the strong categorization for Study 1 (top) and Study 2 (bottom). BI Bayesian inference, DVC deterministic vote counting, PVC proportional vote counting, APBS averaging prior belief and significance b Histogram presenting the weak categorization for Study 1 (top) and Study 2 (bottom). BI Bayesian inference, DVC deterministic vote counting, PVC proportional vote counting, APBS averaging prior belief and significance

