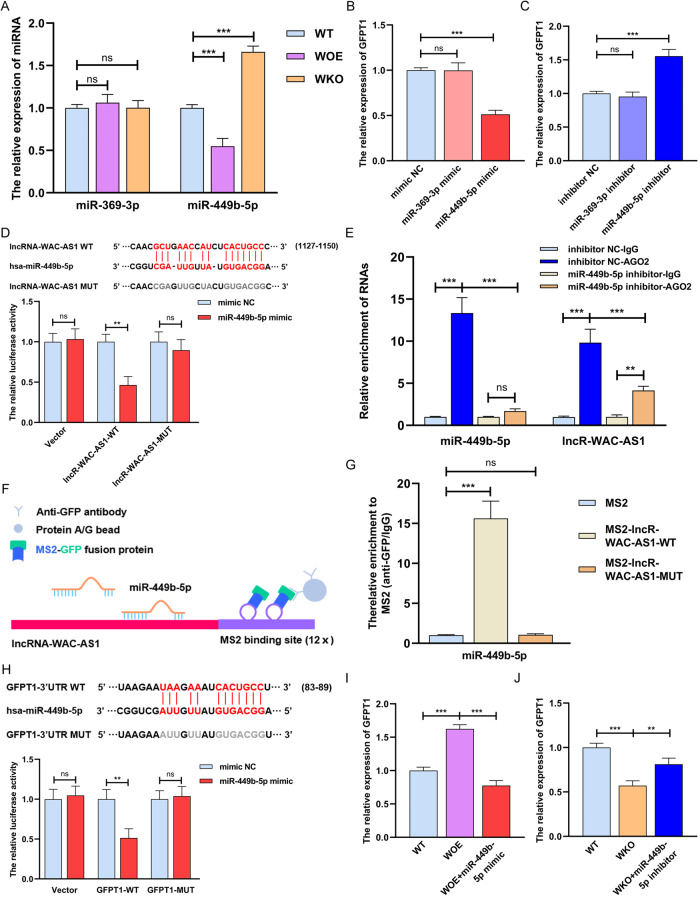
Fig. 2. LncRNA-WAC-AS1 functions as a competing endogenous RNA by directly binding to miR-449b-5p and facilitates GFPT1 expression.
A The relative levels of miRNAs in different HK-2 cell lines (n = 6 group−1); the results were normalized according to miRNA levels in WT; one-way ANOVA followed by Tukey’s test. qRT‒PCR measuring the relative expression of GFPT1 in HK-2 cells transfected with miRNA mimics (B) and inhibitors (C); the results were normalized according to GFPT1 expression in mimic NC or inhibitor NC; one-way ANOVA followed by Tukey’s test. D Parental (WT) and mutant lncRNA-WAC-AS1 sequences were cloned into pGL3-basic plasmid and co-transfected with miR-449b-5p into 293T cells followed by dual luciferase assays (n = 3 group−1); the results were normalized according to the luciferase activity in 293T cells transfected with mimic NC; unpaired 2-tailed Student’s t test. E RIP assays were utilized to pulldown the endogenous RNA associated with AGO2 in HK-2 cells transfected with miR-449b-5p inhibitor or inhibitor NC, and the relative levels of lncRNA-WAC-AS1 and miR-449b-5p were measured and normalized according to the result in IgG group (n = 3 group−1); one-way ANOVA followed by Tukey’s test. F Schematic delineating the strategy of MS2-RIP. G MS2-RIP assays in HK-2 cells followed by qRT‒PCR examining the endogenous binding between lncRNA-WAC-AS1 and miR-449b-5p (n = 3 group−1); the results were normalized according to the miR-449b-5p level in MS2 group; one-way ANOVA followed by Tukey’s test. H Parental and mutant GFPT1 sequences (top) and the luciferase activity in 293T cells (bottom, n = 3 group−1); the results were normalized according to the mimic NC group; unpaired 2-tailed Student’s t test. I, J The results of qRT‒PCR showing the relative levels of GFPT1 in distinct HK-2 cells following different treatments (n = 6 group−1); the expression levels were normalized according to the result in WT HK-2 cells; one-way ANOVA followed by Tukey’s test. ***p < 0.001 and **p < 0.01 represent significant differences between two groups; ns represents no significant difference.

